Multiple Expansion & Tightening Credit Spreads

by Paul Hoffmeister, Chief Economist

Some of the biggest surprises of the last year have been the multiple expansion we’ve seen in the S&P 500, as well as the dramatic tightening of credit spreads. During the last 12 months (through March 2024), S&P 500 earnings have grown approximately 6.8% while the stock index has rallied nearly 27%. As a result, the S&P’s price-to-earnings ratio has climbed four points from almost 19x to 23x. At the same time, the spread between Moody’s Baa and Aaa-rated bonds has narrowed from approximately 120 basis points to 75 today. This spread shows the difference in what investors demand in compensation for loaning money to companies with moderate credit risk and those with the highest credit quality. Both indicate massive risk appetites among investors today.

This multiple expansion and credit tightening is quite remarkable, historically speaking. Since 1993, the average P/E ratio for the S&P 500 has been 18.7 whereas the tightest that the Baa-Aaa spread tends to get is somewhere between 55 and 75 basis points. Today, stocks are meaningfully more expensive than usual, and credit markets are in a zone typical of some of our best economic periods.

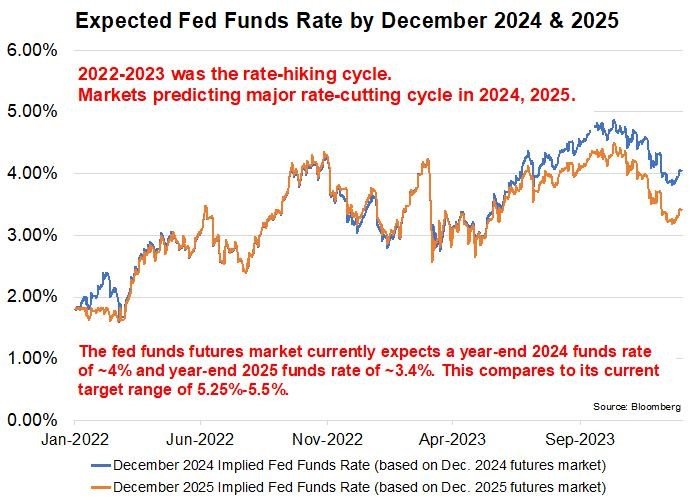
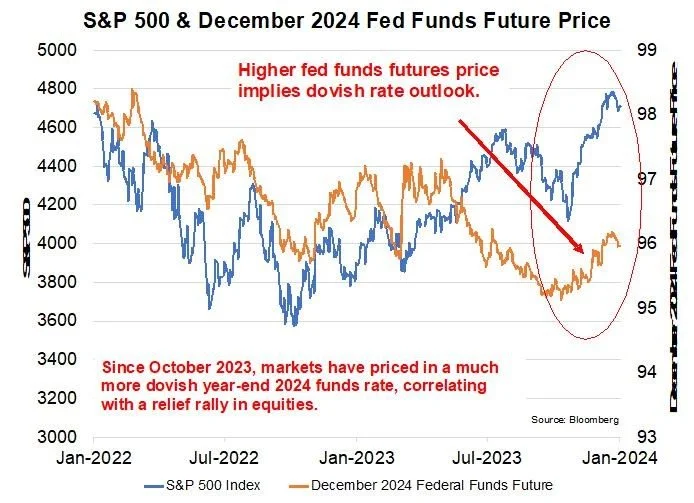
To be sure, the market multiple has been higher in the past and credit spreads have been a little tighter. And, it’s arguably a stretch to say that the market is priced for perfection. But financial markets are pricing in A LOT of optimism. It very well could be that the market believes that Jerome Powell and Co. are successfully threading the needle, by modulating interest rates in almost perfect harmony with the economy. And it could be that investors today are expecting the current Fed pause and possible rate cuts later this year will enable growth to continue or even improve, while at the same allowing inflation to drift lower to the Fed’s 2% target.

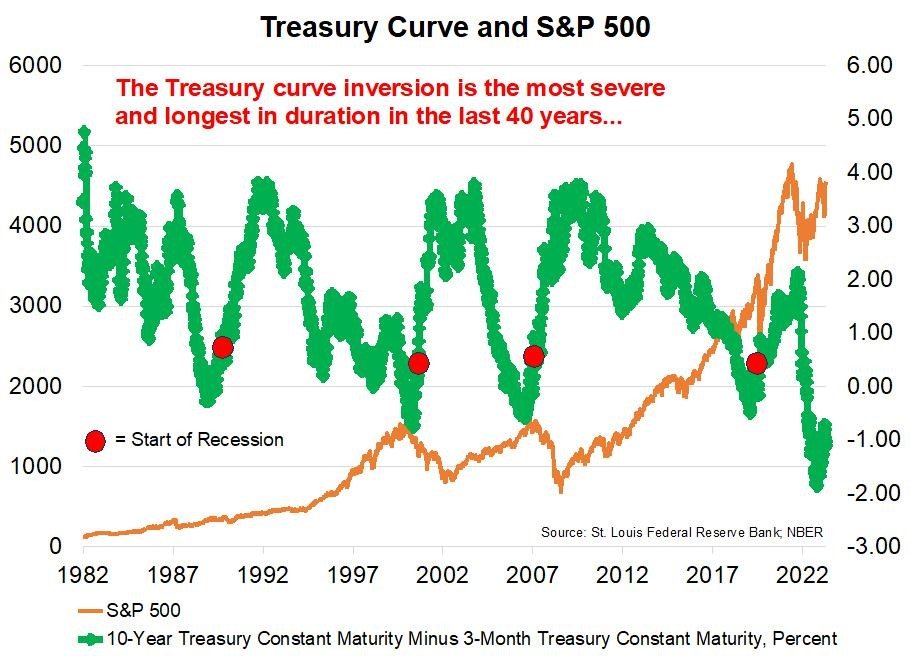
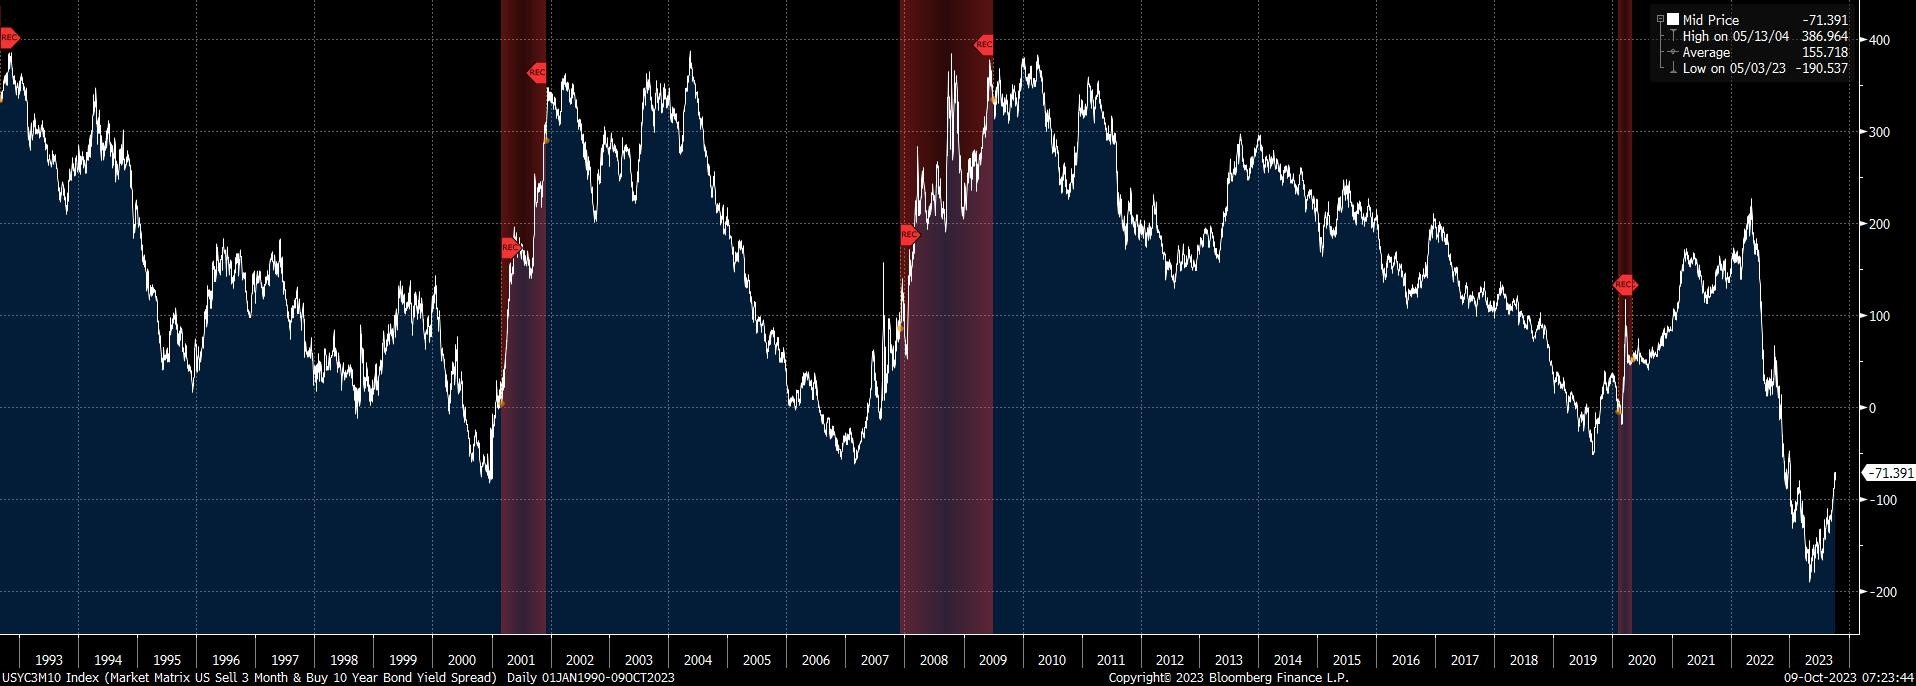
What makes today’s “market exuberance” so surprising is the breadth and magnitude of the risks that we see: Ukraine, the Middle East (Hamas, Hezbollah, Iran), commercial real estate, bank challenges, recently higher-than-expected inflation, the federal deficit, and interest costs on the national debt that are about to seemingly explode. Indeed, these risks could subside, and market optimism today could be justified. Notwithstanding, it seems that a lot of things need to go right for risk assets to maintain current price levels and appreciate further.

In the current opportunity set between stocks and bonds, we believe Treasury bonds are more attractive than stocks. Thanks to years of the Fed pushing up Treasury yields and investors recently marking up the value of equities, we face a somewhat unusual situation where the 10-year Treasury is yielding almost what the S&P 500 is yielding.

At a 22.8 P/E ratio, the earnings yield for the S&P 500 is 4.39%. Meanwhile, the 10-year Treasury yield is yielding approximately 4.35%. This means that there is less than 5 basis points in equity risk premium today. The average has been 2.4% since 2000. Today’s low equity risk premium underscores how expensive stocks are today and how little equity investors are being paid to take on equity risk. As we see it, equity investors will need earnings to grow meaningfully in order to generate sizeable returns in the coming years. That’s if, of course, today’s known and unknown risks don’t materialize.

DIAL IN FOR OUR QUARTERLY

EVENT-DRIVEN CALL

3rd Wednesday of every quarter at 2:00pm EST

REGISTER FOR CALL

Paul Hoffmeister is chief economist and portfolio manager at Camelot Portfolios, managing partner of Camelot Event-Driven Advisors, and co-portfolio manager of the Camelot Event-Driven Fund  (tickers: EVDIX, EVDAX).

Camelot Event-Driven Advisors LLC | 1700 Woodlands Drive | Maumee, OH 43537 // B551


Disclosures:
•       Past performance may not be indicative of future results. Therefore, no current or prospective client should assume that the future performance of any specific investment, investment strategy (including the investments and/or investment strategies recommended by the adviser), will be profitable or equal to past performance levels.
•       This material is intended to be educational in nature, and not as a recommendation of any particular strategy, approach, product or concept for any particular advisor or client.  These materials are not intended as any form of substitute for individualized investment advice.  The discussion is general in nature, and therefore not intended to recommend or endorse any asset class, security, or technical aspect of any security for the purpose of allowing a reader to use the approach on their own.  Before participating in any investment program or making any investment, clients as well as all other readers are encouraged to consult with their own professional advisers, including investment advisers and tax advisors.  Camelot Event Driven Advisors can assist in determining a suitable investment approach for a given individual, which may or may not closely resemble the strategies outlined herein.
•       Any charts, graphs, or visual aids presented herein are intended to demonstrate concepts more fully discussed in the text of this brochure, and which cannot be fully explained without the assistance of a professional from Camelot Portfolios LLC.  Readers should not in any way interpret these visual aids as a device with which to ascertain investment decisions or an investment approach.  Only your professional adviser should interpret this information.
•       Some information in this presentation is gleaned from third party sources, and while believed to be reliable, is not independently verified.
•       Camelot Event-Driven Advisors, LLC, is registered as an investment adviser with the United States Securities and Exchange Commission. Registration as an investment adviser does not imply any certain degree of skill or training. Camelot Event-Driven Advisors, LLC’s disclosure document, ADV Firm Brochure is available at http://adviserinfo.sec.gov/firm/summary/291798

Copyright © 2024 Camelot Event-Driven Advisors, All rights reserved.

An Economy of Contradictions

by Paul Hoffmeister, Chief Economist

The global economy and financial markets are experiencing an unusual set of contradictions. As many of the world’s major central banks have pursued aggressive interest rate increases to stem the post-Covid inflation, major macro indicators appear to be screaming that an economic downturn is in sight. The sovereign yield curves for the United States, Canada, United Kingdom, France and Germany are each inverted. In the United States, the Index of Leading Economic Indicators has declined for 22 consecutive months between March 2022 and January 2024. And money supply measured by M2, considered by some to be the “lifeblood of the economy”, has recently contracted more than at any time since the Great Depression.

And yet, major stock indices from the United States to Canada, Europe and Japan are trading near all-time highs. U.S. real GDP grew 2.5% in 2023, and the unemployment rate is less than 4%.

Dark clouds appear on the horizon, but many aspects of the economy and financial markets today appear highly resilient. So, what’s behind these contradictions? And should we ignore the macro indicators and trust seemingly forward-looking market signals?

In our view, massive spending by the U.S. government and consumers is supporting the economy so far. Furthermore, we’re seeing an AI boom that has ignited mega-cap tech stocks, which has in turn helped to boost headline stock indices.

With regard to the economy, U.S. government spending has been offsetting a lot of the slowdown that the Federal Reserve has been trying to engineer through their interest rate shock campaign. In fiscal year 2023, U.S. federal government net outlays were more than $6.1 trillion. This is nearly as much as the $6.5 and $6.8 trillion in outlays during the peak pandemic years of 2020 and 2021; and it’s much more than 2019 (pre-Covid) outlays of $4.4 trillion.

Just as Covid emergency spending helped to keep the economy afloat amidst widespread lockdowns between 2020 and 2022, the continued elevated spending by the federal government is helping the economy to withstand the headwinds of higher interest rates during the last two years.

Consumers aren’t holding back their spending either. The personal savings rate in the United States was a relatively low 3.7% as of December 2023. Between 2015 and 2020, the personal savings rate generally ranged between 5% and 8%. Today’s historically low savings rate indicates that consumers are stretching themselves financially to stay afloat. At the margin, this is helping to support economic activity.

While we’re seeing monetary and fiscal policies act against each other and consumers reaching deeper into their pockets to make ends meet, big tech has been seemingly in its own world during the last year thanks to the AI boom.

As chatbots went viral last year, major tech companies such as Microsoft, Alphabet and Amazon invested heavily into companies such as OpenAI and Anthropic. In many respects, these investments steered AI-related business, which requires massive amounts of cloud computing power, to these cloud service providers, locking in significant, new revenue streams. Of course, these cloud services companies -- as well as others looking to leverage AI -- rushed to buy the advanced computing chips produced by the likes of companies such as Nvidia.

This nascent technology and related business led to massive rallies in 2023 for the AI-related stocks. For example, stock prices for Microsoft, Alphabet and Amazon were up more than 50% for the year, while Nvidia’s share price appreciated nearly 250%, seemingly becoming a household name.

Zooming out and looking at the global economy from a high level provides more context of today’s economic environment. There is indeed a global slowdown underway, which arguably validates the major macro indicators. China’s economy is in distress (with ground zero being its property sector); Japan, Germany and the UK have fallen into recession; and Canada is close to it, having grown 1% in Q4 after contracting -0.5% in Q3. Indeed, the global interest rate shock appears to be having its intended effect.

While the U.S. economy seems to be an exception so far, its growth environment is not necessarily robust. According to Zerohedge, earnings in the last quarter grew a better than expected 8% year-over-year; but without the Magnificent 7, earnings declined -1.6%. Similarly, while the S&P 500 returned nearly 24% in 2023, were it not for the big returns in the “Magnificent 7”, the S&P would have returned nearly 12%. Indeed, we seem to have a bifurcated economy today, where a small handful of megacap tech stocks are currently prospering but most companies are experiencing a slowdown.

The big question today is, will the United States be able to buck the trend of what seems to be a synchronized global economic slowdown?

A soft-landing in the United States is possible; Alan Greenspan achieved it in 1995. Stocks seem to be pricing for this optimistic scenario.

With the S&P 500 trading near 5100 and expected to earn $241 this year (forecast by Goldman Sachs), its P/E ratio is 21.2. This means that stocks are currently paying an earnings yield of 4.7%. Meanwhile, the 10-year Treasury yield is approximately 4.1%. As such, at 60 basis points, there is very little equity risk premium in the marketplace today. Historically, this risk premium fluctuates, and during the last 15 years, it has averaged almost 3%. Arguably, there isn’t a lot of risk or “cushion” priced into stock prices today. It further suggests that investors are expecting economic growth to persist and earnings growth to accelerate in the coming years.

In our view, however, the economic policy status quo isn’t conducive for a soft-landing and enabling the U.S. to downshift and avoid recession. With interest rates as high as they’ve been in decades, the higher cost of capital is taxing most of the world, which is starting to become apparent.

Could AI boost productivity and growth to such a degree to keep the economy afloat? Sure, but we’re skeptical. Even the emergence of the internet didn’t prevent the recession that started in late 2000.

For a soft-landing scenario, it would likely require some combination of aggressive interest rate cuts from the Fed and proportional cuts from other major central banks, a continuation of today’s historic federal spending, and pro-growth tax cuts to reignite animal spirits throughout the economy.

Unfortunately, Fed officials appear reluctant to cut rates too soon, particularly given recent inflation data that has come in higher-than-expected. Furthermore, ballooning deficits and ever higher interest payments on the national debt are starting to catch the attention of legislators in Washington; and tax cuts are nowhere on the horizon.

Absent major policy shifts, it appears that the wheels of the global economy are grinding slower and slower. But to a certain extent, massive spending and today’s AI boom appear to be offsetting this grind lower, and market prices seem to be optimistic that they’ll succeed.

DIAL IN FOR OUR QUARTERLY
EVENT-DRIVEN CALL
3rd Wednesday of every quarter at 2:00pm EST

REGISTER FOR CALL

Paul Hoffmeister is chief economist and portfolio manager at Camelot Portfolios, managing partner of Camelot Event-Driven Advisors, and co-portfolio manager of the Camelot Event-Driven Fund  (tickers: EVDIX, EVDAX).

Camelot Event-Driven Advisors LLC | 1700 Woodlands Drive | Maumee, OH 43537 // B549


Disclosures:
•       Past performance may not be indicative of future results. Therefore, no current or prospective client should assume that the future performance of any specific investment, investment strategy (including the investments and/or investment strategies recommended by the adviser), will be profitable or equal to past performance levels.
•       This material is intended to be educational in nature, and not as a recommendation of any particular strategy, approach, product or concept for any particular advisor or client.  These materials are not intended as any form of substitute for individualized investment advice.  The discussion is general in nature, and therefore not intended to recommend or endorse any asset class, security, or technical aspect of any security for the purpose of allowing a reader to use the approach on their own.  Before participating in any investment program or making any investment, clients as well as all other readers are encouraged to consult with their own professional advisers, including investment advisers and tax advisors.  Camelot Event Driven Advisors can assist in determining a suitable investment approach for a given individual, which may or may not closely resemble the strategies outlined herein.
•       Any charts, graphs, or visual aids presented herein are intended to demonstrate concepts more fully discussed in the text of this brochure, and which cannot be fully explained without the assistance of a professional from Camelot Portfolios LLC.  Readers should not in any way interpret these visual aids as a device with which to ascertain investment decisions or an investment approach.  Only your professional adviser should interpret this information.
•       Some information in this presentation is gleaned from third party sources, and while believed to be reliable, is not independently verified.
•       Camelot Event-Driven Advisors, LLC, is registered as an investment adviser with the United States Securities and Exchange Commission. Registration as an investment adviser does not imply any certain degree of skill or training. Camelot Event-Driven Advisors, LLC’s disclosure document, ADV Firm Brochure is available at http://adviserinfo.sec.gov/firm/summary/291798

Copyright © 2024 Camelot Event-Driven Advisors, All rights reserved

2024: Year of Transition

by Paul Hoffmeister, Chief Economist

  • We believe the biggest question of 2024 is: what will follow today’s major yield curve inversions?

  • Today, the Fed is signaling a transition from rate hikes to rate cuts.

  • We look at the last three Fed pauses: 2000, 2006 and 2019. The precedents aren’t encouraging. Furthermore, the inverted yield curves of the major Western economies (USA, Canada, UK, France, Germany) are sending an ominous signal.

  • The strong labor market and relatively resilient earnings in the United States are arguably keeping stock prices strong. But economic weakness is emerging.

Biggest Question of 2024 & 2025: What Follows This Inversion?

- The previous episodes of Treasury curve inversion led to significant financial and economic harm: the 1989-1990 S&L crisis, bursting of the tech bubble, and the Global Financial Crisis -- as well as recessions on each occasion.
- Today’s yield curve is even more inverted today. We saw major bank failures in Q1 2023, but no recession in the United States. Is that the extent of the financial and economic implications of this interest rate cycle? This is arguably the most important financial question today.

Fed Transitioning From Rate-Hiking to Rate-Cutting

- The dovish shift in the interest rate outlook highlights that this will be a transition year, as we go from the interest-rate hiking cycle of 2022-2023 to the interest rate-cutting cycle of 2024.
- Market expectations for where funds rate will be at end of 2024 and 2025 have declined by 75 to 100 basis points since October.
- Currently, the FOMC is targeting a funds rate range of 5.25%-5.50%. The market expects the fed funds rate to be ~4% by year-end 2024, and ~3.4% by year-end 2025.
- According to the Chicago Mercantile Exchange, fed funds futures suggest that the rate-cutting cycle will begin at the FOMC’s March 20 meeting.

Inflation Falling

- What’s behind the dovish expectations that have emerged in recent months?
- Data are indeed showing a decline in inflation.
- Absent an escalation of geopolitical instability, inflation could continue to behave and give the Fed room to cut interest rates in 2024.

Dovish Outlook Fueled Late 2023 Relief Rally

- The S&P jumped more than 15% from its October lows to recent levels.
- Worsening Fed expectations (higher rate expectations) throughout 2022 and early 2023 correlated with weaker stock prices. But that correlation broke down for a few months starting in March 2023, most likely underscoring the importance of the Fed’s “BTFP” program intervention in response to the bank failures at the time.

Bank Stocks Outperform in Late 2023

- Bank stocks jumped more than 30% from their October lows to recent levels.
- In terms of sectors, financials arguably took the interest rate-hiking cycle the most on the chin. KRE fell more than 50% from its 2021 high to its May 2023 low.
- This is understandable. Some banks were blindsided by the Fed changing its telegraph of low rates for a long time to aggressive interest rate increases. Silicon Valley Bank, First Republic, and Credit Suisse were the notable casualties.

Dovish Re-Pricing Tightened Credit Spreads

- Another economically positive byproduct of the dovish shift in late 2023 has been the subsequent tightening in credit spreads, indicating an improvement in financing conditions and risk-taking. This should help economic growth at the margin.

Rate Cycle Transition 2000-2001

- How have equity markets previously behaved in response to a Fed pause after a prolonged rate-hiking cycle? 2000, 2006 and 2019 are the most recent precedents.
- The precedents aren’t too encouraging.
- The 2000 Fed pause was followed by equity market weakness (and coincident economic weakness due to the tech wreck) and ultimately an aggressive rate cut response by the Greenspan Fed.

Rate Cycle Transition 2006-2007

- The 2006 Fed pause was initially followed by a stock market rally. But economic weakness and aggressive Fed policy easing ultimately emerged.

Rate Cycle Transition 2019-2020

- The early 2019 Fed pause was initially followed by a stock market rally. But stock market and economic weakness eventually emerged, causing the Fed to start cutting rates in August 2019.
- Of course, in Q1 2020, the Covid pandemic catalyzed aggressive rate cuts and other monetary measures.

Stocks Holding Up So Far. Why?

- Bears were arguably wrong in 2023. Why? Today’s high government spending (that supported spending and employment) is one possible factor. As we see it, the labor market and earnings were two shoes that didn’t drop last year. Indeed, the labor market and S&P 500 earnings were seemingly irrepressible last year. But will that condition continue in 2024?
- So far, the US unemployment rate is strong at 3.7%. In the past, increases in the unemployment rate corresponded with weak stock indices.
- If the unemployment rate jumps in 2024, that will likely be a headwind for equity returns.

Stocks Holding Up So Far. Why?

- S&P 500 earnings have held up relatively well during the last year.
- However, previous inverted yield curve episodes preceded significant declines in earnings.
- History suggests that both labor markets and earnings are likely to weaken in 2024. Such a combination doesn’t bode well for equities.

Bond Markets: Ominous Signal?

- Today, many analysts are predicting that the economy will achieve a soft landing after the interest rate shock of 2022-2023.
- But the bond market might be predicting something different. Or is it?
- The government bond curves for the major Western economies (US, Canada, UK, France and Germany) are each inverted and collectively inverted to a degree we’ve never seen in recent decades.
- A pessimistic interpretation of this is that most of the global economy is headed toward a hard landing and severe recession.
- An optimistic interpretation is that the inflation outlook is rapidly improving and Fed policymakers are going to cut rates in 2024-2025, thereby engineering a soft landing.

Unemployment Turning Higher?

- Unemployment in the major Western economies are, for the most part, starting to turn for the worse. Italy is an exception.
- Previous turns in unemployment in Western economies correlated with recession, particularly in the United States.

US Employment Picture

- In the United States, we are seeing a meaningful deterioration in unemployment conditions.
- These permanent job losses are reminiscent of the early stages of the 2001-2002 and 2007-2009 recessions.

Global Manufacturing Picture

- Global manufacturing has been contracting since September 2022 – that’s 15 straight months.

US Services Sector

- US services sector is dangerously close to contraction.
- Typically, contractions in the US service sector coincide with recession.
- In 2021, the US service sector comprised ~78% of the US economy, according to Statista.

US Banking Conditions

- In his November 29, 2023 statement, FDIC Chairman Martin Gruenberg stated: “…the banking industry again proved to be resilient in the third quarter. After excluding non–recurring accounting gains in the first half of 2023, net income would have been roughly flat for the past four quarters at a level considered high by historical measures. In addition, overall asset quality metrics remained favorable and the industry remains well capitalized. However, the banking industry still faces significant challenges from the effects of inflation, rising market interest rates, and geopolitical uncertainty. These risks, combined with concerns about commercial real estate fundamentals, especially in office markets, as well as continued pressure on funding levels and earnings, will be matters of continued supervisory attention by the FDIC.” (source: FDIC: Speeches, Statements & Testimonies - 11/29/2023 - Remarks by FDIC Chairman Martin Gruenberg on the Third Quarter 2023 Quarterly Banking Profile)

In Conclusion ...

  • Today, the 10-year/3-month Treasury spread is the most inverted it has been since the early 1980s. Furthermore, the sovereign curves of the major Western economies are simultaneously inverted, to significant degrees, casting a worrisome signal of economic prospects.

  • Global manufacturing is weak, US manufacturing is contracting, and the US service sector appears to be on the verge of contraction. At the same time, unemployment rates for many of the major Western economies appear to be turning higher. The confluence of these variables suggest that many countries are entering recession.

  • The Fed is signaling an end to its recent interest-rate hiking cycle and the likelihood of rate cuts in 2024. The Fed rate pauses of 2000, 2006, and 2019 didn’t preclude subsequent economic and equity market weakness.

DIAL IN FOR OUR QUARTERLY
EVENT-DRIVEN CALL
3rd Wednesday of every quarter at 2:00pm EST

REGISTER FOR CALL

Paul Hoffmeister is chief economist and portfolio manager at Camelot Portfolios, managing partner of Camelot Event-Driven Advisors, and co-portfolio manager of the Camelot Event-Driven Fund  (tickers: EVDIX, EVDAX).

Camelot Event-Driven Advisors LLC | 1700 Woodlands Drive | Maumee, OH 43537 // B529
 
Disclosures:
•       Past performance may not be indicative of future results. Therefore, no current or prospective client should assume that the future performance of any specific investment, investment strategy (including the investments and/or investment strategies recommended by the adviser), will be profitable or equal to past performance levels.
•       This material is intended to be educational in nature, and not as a recommendation of any particular strategy, approach, product or concept for any particular advisor or client.  These materials are not intended as any form of substitute for individualized investment advice.  The discussion is general in nature, and therefore not intended to recommend or endorse any asset class, security, or technical aspect of any security for the purpose of allowing a reader to use the approach on their own.  Before participating in any investment program or making any investment, clients as well as all other readers are encouraged to consult with their own professional advisers, including investment advisers and tax advisors.  Camelot Event Driven Advisors can assist in determining a suitable investment approach for a given individual, which may or may not closely resemble the strategies outlined herein.
•       Any charts, graphs, or visual aids presented herein are intended to demonstrate concepts more fully discussed in the text of this brochure, and which cannot be fully explained without the assistance of a professional from Camelot Portfolios LLC.  Readers should not in any way interpret these visual aids as a device with which to ascertain investment decisions or an investment approach.  Only your professional adviser should interpret this information.
•       Some information in this presentation is gleaned from third party sources, and while believed to be reliable, is not independently verified.
•       Camelot Event-Driven Advisors, LLC, is registered as an investment adviser with the United States Securities and Exchange Commission. Registration as an investment adviser does not imply any certain degree of skill or training. Camelot Event-Driven Advisors, LLC’s disclosure document, ADV Firm Brochure is available at http://adviserinfo.sec.gov/firm/summary/291798

Copyright © 2024 Camelot Event-Driven Advisors, All rights reserved.

Labor Market Threatens Equities

by Paul Hoffmeister, Chief Economist

  • Treasury curve most inverted since 1980’s.

  • Longest period of inversion since 1980’s.

  • Russell 2000 has significantly underperformed the S&P 500 and Nasdaq QQQ since banking problems last March; arguably a sign of flight to safety and weakening economic fundamentals.

  • Cooling labor market tends to correlate with weak equity performance.

Two big financial stories of 2023 are the inverted yield curve and the strong returns in large cap stocks. The first is an ominous signal, and the second doesn’t seem too encouraging for the economic outlook.
First, the yield curve. We’re currently witnessing the most inverted Treasury curve since the early 1980’s; not to mention, since then, the yield curve has never been inverted for this length of time.

When looking at the economic history, the inversions that have occurred during the last 4 decades have preceded recessions every time. Specifically, there have been four episodes of inversion, and after each, a recession occurred (with start dates in 1990, 2001, 2007, and 2020). When we assess today’s yield curve alongside other economic indicators, as we’ve laid out in previous client letters, we believe that history will repeat itself and recession will begin in 2024.

Notwithstanding the worrisome outlook that Treasury bonds are suggesting, there is a lot of talk that there will be “no landing” or a “soft landing”; i.e. a recession will be avoided or it’ll be shallow. One of the most popular arguments is the strength of the stock market this year. The S&P 500 is up nearly 19%, and the Nasdaq QQQ’s more than 35%. Indeed, these year-to-date gains in the major indices are impressive. But if we “zoom out”, we get a little better context of what might be happening.

The strong equity returns are not broad-based. Instead, the strength tends to be weighted in large caps and technology. The small cap Russell 2000 Index is up just 7% this year.

As we see it, the outperformance of large cap tech stocks may be a flight to safety in an increasingly precarious economic environment. Furthermore, the stark underperformance by small and more economically sensitive companies isn’t the sign of a vibrant, healthy economy, but rather the sign of weakening economic underpinnings that, in its early stages, is most noticeably impacting the more vulnerable. In terms of vulnerability, Apollo currently estimates that nearly 40% of Russell 2000 companies have negative earnings.  

What’s most noteworthy about the stark difference in stock market performance between large and small caps is the timeline of the divergence in their performance. When the prospects of Fed rate increases began to emerge in early 2022, both tended to perform somewhat “in sync”. But this behavior appears to have broken down since March 2023 when banking problems emerged in the United States and Europe (with the failures of Silicon Valley Bank on March 10 and Signature Bank on March 12, and the takeover of Credit Suisse on March 19). Since the collapse of Silicon Valley Bank on March 10, the S&P 500 has soared nearly 18% and Nasdaq QQQ 33%, while the Russell 2000 has returned almost 6%.

These market internals are more worrisome than heartening, and suggests to us that deeper risks are brewing, and perhaps the banking problems last spring were the early casualties of the current downturn in the business cycle.

As we’ve outlined in recent months, we believe some of the major macro risks today are the real estate crisis and financial risks in China, economic slowdown in Europe (Germany is already in recession), the consumer squeeze, tighter lending conditions, geopolitical risks (Ukraine, Middle East, and Taiwan), and the implications of the weakening commercial real estate sector on banks.

Indeed, weeks ago, FDIC Chairman Martin Gruenberg neatly summarized the risks posed by commercial real estate:

…deterioration in the [banking] industry’s commercial real estate portfolio is beginning to materialize in office properties, in which weak demand for space, softening property values, and higher interest rates are affecting the credit quality of underlying loans. Total noncurrent non–owner–occupied commercial real estate loans increased 36.4 percent from last quarter, and the noncurrent rate for these loans is the highest since third quarter 2014. Higher interest rates pose risks for other commercial real estate properties as well, as maturing fixed–rate loans will need to be renewed at what are now much higher market interest rates.

In other words, noncurrent non-owner-occupied commercial real estate today is the highest in nine years, and the high interest rates today will be especially negative for these fixed-rate loans that are maturing because they’ll need to be refinanced at much higher interest rates. As a result, the risk to banks with large exposures to commercial real estate is likely to be a major story in 2024.  

Based on the economic data in recent months, it appears the slowdown is underway. This was recently acknowledged by Federal Reserve Governor Christopher Waller, who cited October data indicating that consumer spending, manufacturing and non-manufacturing activity are each slowing; meanwhile the labor market is “cooling off”. Indeed, the US unemployment rate has risen from 3.4% in April to 3.9% in October.

DIAL IN FOR OUR QUARTERLY
EVENT-DRIVEN CALL
3rd Wednesday of every quarter at 2:00pm EST

REGISTER FOR CALL

Paul Hoffmeister is chief economist and portfolio manager at Camelot Portfolios, managing partner of Camelot Event-Driven Advisors, and co-portfolio manager of the Camelot Event-Driven Fund  (tickers: EVDIX, EVDAX).

Camelot Event-Driven Advisors LLC | 1700 Woodlands Drive | Maumee, OH 43537 // B525

 
Disclosures:
•       Past performance may not be indicative of future results. Therefore, no current or prospective client should assume that the future performance of any specific investment, investment strategy (including the investments and/or investment strategies recommended by the adviser), will be profitable or equal to past performance levels.
•       This material is intended to be educational in nature, and not as a recommendation of any particular strategy, approach, product or concept for any particular advisor or client.  These materials are not intended as any form of substitute for individualized investment advice.  The discussion is general in nature, and therefore not intended to recommend or endorse any asset class, security, or technical aspect of any security for the purpose of allowing a reader to use the approach on their own.  Before participating in any investment program or making any investment, clients as well as all other readers are encouraged to consult with their own professional advisers, including investment advisers and tax advisors.  Camelot Event Driven Advisors can assist in determining a suitable investment approach for a given individual, which may or may not closely resemble the strategies outlined herein.
•       Any charts, graphs, or visual aids presented herein are intended to demonstrate concepts more fully discussed in the text of this brochure, and which cannot be fully explained without the assistance of a professional from Camelot Portfolios LLC.  Readers should not in any way interpret these visual aids as a device with which to ascertain investment decisions or an investment approach.  Only your professional adviser should interpret this information.
•       Some information in this presentation is gleaned from third party sources, and while believed to be reliable, is not independently verified.
•       Camelot Event-Driven Advisors, LLC, is registered as an investment adviser with the United States Securities and Exchange Commission. Registration as an investment adviser does not imply any certain degree of skill or training. Camelot Event-Driven Advisors, LLC’s disclosure document, ADV Firm Brochure is available at http://adviserinfo.sec.gov/firm/summary/291798

Copyright © 2023 Camelot Event-Driven Advisors, All rights reserved.

Yield Curve Steepening!

by Paul Hoffmeister, Chief Economist

  • Recent yield curve steepening suggests the US economy is slowing down and could enter recession by mid-2024.

  • S&P 500 performance is likely to be limited during the next year given the post-2000 history of yield curve steepening out of deep inversions and with the Fed pursuing a “higher for longer” policy approach.

  • The recent 3.7% unemployment reading doesn’t necessarily prevent a recession from happening soon.

Since July 31st, the S&P 500 has declined more than 6%. But seemingly missed in most market commentary is the fact that the yield curve is experiencing the most aggressive steepening since 2000. During the last 5 months, the spread between the 10-year Treasury yield and 3-month T-Bill has steepened from negative 190 basis points to negative 71 basis points (as of last Friday).

As the chart below shows, the last three recessions began after a steepening from deep inversions occurred. In December 2000, the yield curve reached maximum inversion, and the recession began in March 2001 (3 months later). In February 2007, the yield curve reached maximum inversion, and the recession began in December 2007 (10 months later). In August 2019, the curve reached maximum inversion, and recession began in February 2020 (6 months later).

If the post-2000 relationship between the yield curve and onset of recession is any guide, it’s likely that the next recession in the United States will begin soon; perhaps before year-end or during the first half of 2024. This makes sense considering that interest rate futures are currently pricing in the probability of interest rate cuts in Q3 2024.

Spread between 10-year Treasury/3-month Treasury bill; recession periods highlighted in red. (Source: Bloomberg)

What does this mean for equities? The 2000-2001 and the 2007-2008 steepenings into recession correlated with a weak and declining S&P 500. The 2019-2020 steepening experienced a rising S&P 500 until the Covid pandemic and global shutdown commenced in February 2020, which then triggered both a major equity market selloff and recession. It’s worth noting that by the late summer of 2019, the Federal Reserve had already started cutting rates, which arguably supported equity prices during the second half of that year.    

Spread between 10-year Treasury/3-month Treasury bill AND the S&P 500; recession periods highlighted in red. (Source: Bloomberg)

Bottomline: We believe the recent yield curve steepening is further evidence that we are in the early stages of an economic slowdown and contraction. Furthermore, if contraction does occur, history suggests a strong likelihood of weak equity markets during the next year.

Unfortunately, this year’s strong labor market data -- such as September’s 3.7% unemployment reading from the Bureau of Labor Statistics -- seem to be compelling Federal Reserve policymakers to maintain high interest rates for a longer period of time. In our view, these backward-looking indicators are misleading, and the “higher for longer” policy approach is putting a stranglehold on the economy. After all, the recessions of 2001, 2008-2009, and 2020 began when quarterly unemployment rates had just bottomed at 3.9%, 4.7% and 3.6% respectively. A low unemployment rate today doesn’t necessarily preclude a looming recession.

DIAL IN FOR OUR QUARTERLY
EVENT-DRIVEN CALL
3rd Wednesday of every quarter at 2:00pm EST

REGISTER FOR CALL

Paul Hoffmeister is chief economist and portfolio manager at Camelot Portfolios, managing partner of Camelot Event-Driven Advisors, and co-portfolio manager of the Camelot Event-Driven Fund  (tickers: EVDIX, EVDAX).

Disclosures:
•       Past performance may not be indicative of future results. Therefore, no current or prospective client should assume that the future performance of any specific investment, investment strategy (including the investments and/or investment strategies recommended by the adviser), will be profitable or equal to past performance levels.
•       This material is intended to be educational in nature, and not as a recommendation of any particular strategy, approach, product or concept for any particular advisor or client.  These materials are not intended as any form of substitute for individualized investment advice.  The discussion is general in nature, and therefore not intended to recommend or endorse any asset class, security, or technical aspect of any security for the purpose of allowing a reader to use the approach on their own.  Before participating in any investment program or making any investment, clients as well as all other readers are encouraged to consult with their own professional advisers, including investment advisers and tax advisors.  Camelot Event Driven Advisors can assist in determining a suitable investment approach for a given individual, which may or may not closely resemble the strategies outlined herein.
•       Any charts, graphs, or visual aids presented herein are intended to demonstrate concepts more fully discussed in the text of this brochure, and which cannot be fully explained without the assistance of a professional from Camelot Portfolios LLC.  Readers should not in any way interpret these visual aids as a device with which to ascertain investment decisions or an investment approach.  Only your professional adviser should interpret this information.
•       Some information in this presentation is gleaned from third party sources, and while believed to be reliable, is not independently verified.
•       Camelot Event-Driven Advisors, LLC, is registered as an investment adviser with the United States Securities and Exchange Commission. Registration as an investment adviser does not imply any certain degree of skill or training. Camelot Event-Driven Advisors, LLC’s disclosure document, ADV Firm Brochure is available at http://adviserinfo.sec.gov/firm/summary/291798

Copyright © 2023 Camelot Event-Driven Advisors, All rights reserved.