

By Paul Hoffmeister, Chief Economist
October 2, 2018
· With real GDP growing at +4.2% in Q2 2018, the ISM Manufacturing Index at 59.8, and jobless claims now running at nearly 206,000 and apparently still in a downtrend, the US economy is arguably strong.
· While the economy is being boosted by fiscal and regulatory levers, the Federal Reserve is pulling back on its monetary lever. At what point will the Fed stop raising interest rates? Will the Fed “thread the needle” and end its rate increases before any serious economic consequences emerge? Or, will it continue this prolonged, gradual rate hiking cycle until something breaks in the economy?
· Chairman Powell’s statements during the recent FOMC press conference suggest to us that the Fed will continue raising rates until the economy cracks slightly, or breaks.
· Given that statistical inflation is low, the Treasury curve is close to inverting, and the strong dollar seems to be creating stresses in emerging markets, we believe the Fed should pursue monetary policy like it did in 1995, by stopping short of inversion. It could be the best decision for stocks and the economy. Otherwise, the continuation of the current interest rate cycle will likely limit equity gains and create economic tail risks.
Economic Update
The US economy is, in our view, performing very well. According to the Bureau of Economic Analysis, real GDP has accelerated from +1.9% during the third quarter of 2016 to +4.2% as of the end of the second quarter 2018. The Manufacturing Index from the Institute for Supply Management stood at 59.8 in September, compared to nearly 50 during the third quarter of 2016. Furthermore, the Department of Labor reported that, as of late September, the 4-week moving average for jobless claims was almost 206,000, compared to nearly 250,000 during the third quarter of 2016, signaling a continued downtrend in the number of people receiving unemployment insurance benefits.
The economy is growing strongly, and the robust manufacturing and employment environments suggest that a significant economic slowdown isn’t on the near-term horizon. For instance, each of the last five recessions since 1980 began when the ISM Manufacturing Index was less than or equal to 50.1. And, each of the last five recessions was preceded by an upward sloping trend in jobless claims.

Arguably, improved incentives to produce spurred by lower corporate tax rates (signed into law in December 2017) and less corporate regulation (underway since January 2017) are driving much of the upturn in the economy.
Prior to last year’s reduction in the corporate tax rate to 21% (from 35%), the United States had the fourth highest statutory corporate income tax rate in the world, according to the Tax Foundation. Today, it is pegged almost two percentage points below last year’s world average of 22.96%.[1] More competitive American firms and the more attractive after-tax return potential of corporate investments are likely driving more business activity.
Also, the pace of regulation is significantly slower today than any other period since 1970. According to the Program for Economic Research on Regulation at George Mason University, federal regulations grew 0.65% during the first year of the Trump Administration. This compares to the 2.1% annual average between 1970 and 2016.[2]
Even more, the pace of reviews for significant new regulations has at the same time slowed. The Office of Information and Regulatory Affairs reviewed 60 rules deemed “economically significant” between January 21, 2017 and January 20, 2018. According to the New York Times, the last time so few rules of this kind were considered was in 1984 under President Reagan.[3]
But of course, with the economy being boosted by fiscal and regulatory levers, the Federal Reserve is pulling back on its monetary lever. The predominant question facing investors today is, at what point do higher interest rates offset today’s positive economic environment and become a serious headwind?
We appear to be getting closer to the point that Fed policy is meaningfully detrimental, and it could be signaled by today’s flattening yield curve, which is close to inverting.
An inverted yield curve has often preceded economic contractions. The New York Federal Reserve Bank, which conducts some of the leading research on the relationship between credit spreads and economic activity, states on its website: “The yield curve has predicted essentially every U.S. recession since 1950 with only one ‘false’ signal, which preceded the credit crunch and slowdown in production in 1967.”
All the more, in their seminal research in 1996, economists Arturo Estrella and Frederic Mishkin found that the spread between 10-year and 3-month Treasuries significantly outperformed other financial and macroeconomic indicators – namely the NYSE Stock Price Index, the Index of Leading Indicators, and the Stock-Watson Index – in predicting recessions two to six quarters ahead.[4] Quite simply, a narrowing of the 10-year/3-month Treasury spread could reliably signal a greater likelihood of recession.
According to the New York Federal Reserve, the narrowing of the 10-year/3-month Treasury spread from 106 basis points at the end of 2017 to 82 basis points at the end of August has increased the probability of a recession by the end of August 2019 to 14.61%. This is the highest level since late 2008. This estimate of recession starting within one year was just 4.06% at the end of December 2017.

To us, this simple yet powerful model suggests that current Fed policy is substantially increasing risks to the economy. And it begs the question, at what point will the Fed stop raising rates? Will the Fed effectively “thread the needle”; that is, will it end its rate increases before any serious economic consequences emerge? Or, will the Fed continue this prolonged, gradual rate hiking cycle until something breaks? We may have recently gotten some clues to the answer.
Fed Chairman Powell was pointedly asked this question by the Wall Street Journal’s Nick Timiraos during the FOMC press conference on September 26.
Nick Timiraos (Wall Street Journal): “Chairman Powell, given the lags of monetary policy, I want to know how you think about ending the tightening cycle. How will you know when to stop? And do you need to keep going until something in the economy breaks?”
Jerome Powell: “So the tightening cycle, as you know, is a reflection of the strength of the economy. And it’s, it’s almost three years now that we’ve been gradually increasing rates. And I think the fact that we have moved quite gradually, in a way, allows us to carefully watch incoming data in the real economy and in the financial markets to see how the economy is processing higher interest rates. And the fact that we’re moving so gradually, I think, I think it limits the long and variable lags problem because, you know, we’re being able to raise rates and wait and see how the economy absorbs these rate increases. And so far the economy has performed very well and in keeping with our expectations.”[5]
It seems, based on this answer, that Powell and the Federal Open Market Committee, in general, are counting on their gradual rate increases to both softly acclimate the economy to higher interest rates and give the Committee enough lead time to monitor how the economy and financial markets are handling them.
In a follow-up question, Paul Kiernan from Dow Jones asked Powell about what precisely Fed policymakers will be looking at to gauge the impact of rate increases.
Paul Kiernan (Dow Jones Newswires): “…I’d like to just kind of ask again. You mentioned earlier the gradual pace of rate increases will make it easier to react. But specifically what are you going to be looking to see because you’ve also mentioned, you know, that monetary policy operates with a lag, so any kind of specific sign posts that maybe we’ve reached the end of the tightening cycle or where we should stop?…”
Jerome Powell: “…Some of the things we’d be looking at to tell us whether we’re getting close to supply-side limits would be, first, does job growth slow down? A slowing down in job growth would be an indicator. You know, an unexpectedly sharp increase in wages or inflation could tell you that you’re reaching those points. You know, if headline growth slowed down, that’s another one. So all of those things would be worth taking into consideration. I think also, though, we’ve seen sometimes sharp tightening in financial conditions as we saw at the beginning of 2016 can have a substantial effect pretty quickly on our economy, if it’s a broad and significant tightening. So we would be looking for those kinds of things and many other things…”[6]
Based on Powell’s answers, it seems that Fed policymakers will choose to abandon their rate-hiking cycle when certain negative conditions, such as a deteriorating job market or tightening financial conditions, present themselves. And such conditions, arguably, present themselves when real cracks in the economy are occurring.
As a result, the Fed is likely to continue raising interest rates until the economy either cracks slightly, or breaks. This foreboding trajectory of monetary policy, we believe, will limit equity gains during the next 12-24 months.
It appears that the Federal Reserve is not giving sufficient deference today to the yield curve signal, nor the stresses that the strong dollar is creating in emerging markets, which threaten to create currency crises similar to 1997-1998.
Why raise interest rates further and threaten to invert the yield curve, especially when the overall PCE inflation rate for August was 1.3% annualized?[7]
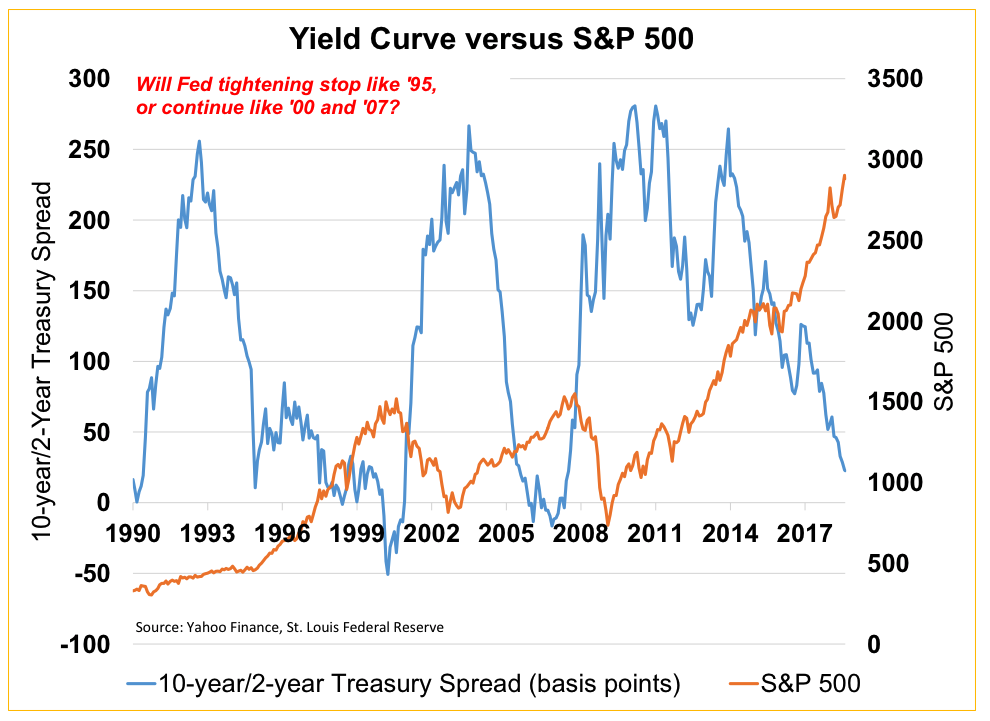
With the 10-year/2-year Treasury spread trading at nearly 23 basis points in September, it is not far from inverting. In our view, the Fed should treat interest rate policy as if it were 1995, when the Federal Reserve, by ending its rate hiking cycle, stopped short of inverting the yield curve. This policy shift coincided with a strong equity market rally and likely laid part of the foundation for the economic success of the late 1990s. Unfortunately, from Chairman Powell’s recent statements, it appears that the Fed will ominously pursue a policy course more similar to 2000 and 2007.

Paul Hoffmeister is chief economist and portfolio manager at Camelot Portfolios, managing partner of Camelot Event-Driven Advisors, and co-portfolio manager of Camelot Event-Driven Fund (tickers: EVDIX, EVDAX).
*******
Disclosures:
• Past performance may not be indicative of future results. Therefore, no current or prospective client should assume that the future performance of any specific investment, investment strategy (including the investments and/or investment strategies recommended by the adviser), will be profitable or equal to past performance levels.
• This material is intended to be educational in nature, and not as a recommendation of any particular strategy, approach, product or concept for any particular advisor or client. These materials are not intended as any form of substitute for individualized investment advice. The discussion is general in nature, and therefore not intended to recommend or endorse any asset class, security, or technical aspect of any security for the purpose of allowing a reader to use the approach on their own. Before participating in any investment program or making any investment, clients as well as all other readers are encouraged to consult with their own professional advisers, including investment advisers and tax advisors. Camelot Portfolios LLC can assist in determining a suitable investment approach for a given individual, which may or may not closely resemble the strategies outlined herein.
• Any charts, graphs, or visual aids presented herein are intended to demonstrate concepts more fully discussed in the text of this brochure, and which cannot be fully explained without the assistance of a professional from Camelot Portfolios LLC. Readers should not in any way interpret these visual aids as a device with which to ascertain investment decisions or an investment approach. Only your professional adviser should interpret this information.
• Some information in this presentation is gleaned from third party sources, and while believed to be reliable, is not independently verified.
• A672
[1] “Corporate Income Tax Rates around the World, 2017”; https://taxfoundation.org/corporate-income-tax-rates-around-the-world-2017/
[2] “Trump Says ‘No President Has Cut So Many Regulations’. Not Quite”, by Linda Qiu, February 23, 2018, New York Times.
[3] Ibid.
[4] “The Yield Curve as a Predictor of U.S. Recessions”, by Arturo Estrella and Frederic Mishkin, June 1996, Current Issues in Economics and Finance, Federal Reserve Bank of New York.
[5] FOMC Press Conference, September 26, 2018.
[6] Ibid.
[7] Source: Bureau of Economic Analysis