Markets, the Coronavirus and Joe Biden

By Paul Hoffmeister

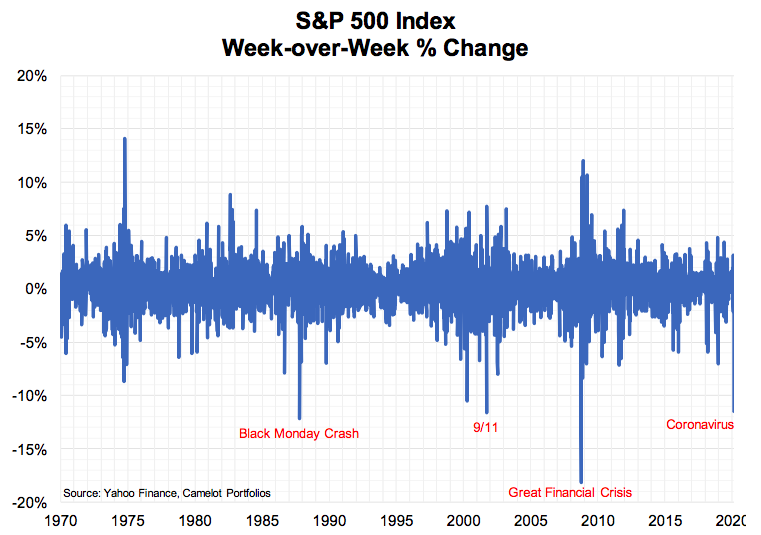
The week of February 24, 2020 will go down in history. The S&P 500’s 11.5% selloff for the week, caused by panic over the Coronavirus, was the fourth worst week-over-week loss for the index since 1970, just behind the week-over-week selloffs during the 2008 Financial Crisis, the October 1987 stock market crash, and the 9/11 terrorist attacks.

Screen Shot 2020-03-10 at 9.21.30 AM.png

What appeared to spark the selloff were reports of viral outbreaks in Italy, South Korea and Iran. In Italy, it was reported that over 200 people had been infected, and at least 10 towns with a population of nearly 50,000 were locked down.[i] In South Korea, the total number of confirmed cases had jumped to more than 800, and the country raised its infectious disease alert to its highest level.[ii] And in Iran, total confirmed cases jumped to almost 50.[iii] The sudden case increases in these countries raised concern that the efforts to contain Covid-19 in Southeast Asia had failed, and that the world was now at the brink of a global pandemic.

Very likely, we’re already there. On Tuesday March 3,, Dr. Anne Schupat, the principal deputy director at the CDC, testified before Congress that the virus had already met two of the three main criteria under the technical designation of a pandemic.[iv] She added, “If sustained person-to-person spread in the community takes hold outside China, this will increase the likelihood that the WHO will deem it a global pandemic.”[v]

It may well be taking hold. Notably, on Wednesday February 26, the CDC reported in California the first incident in the United States of “community transmission” where an infected person was not exposed to anyone known to have been infected with the Coronavirus.[vi] The virus may in fact be more widespread than the official data is currently showing. With testing for the virus now rapidly increasing around the world, it’s likely that we will see a surge in confirmed cases that will meet the conditions for this outbreak to be classified as a global pandemic.

So, as investors, where do we go from here? How do we navigate a variable whose outcomes are highly uncertain and difficult to measure?

Arguably no one can guess how exactly the virus will evolve from here. That would be pure speculation. But perhaps the recent events in China can give us clues about how to think about the next few months, specifically with regard to the spread of the virus and the degree of any US equity selloff.

What may be exceedingly useful is the fact that it appears China is in the late innings of working through the virus, while the rest of the world is in the early innings. According to the World Health Organization, the Coronavirus is now spreading faster outside China. The number of confirmed cases outside mainland China exceeded 10,000 on March 3, compared to 80,300 in China; with 80% of new cases coming from Italy, Iran and South Korea.[vii]

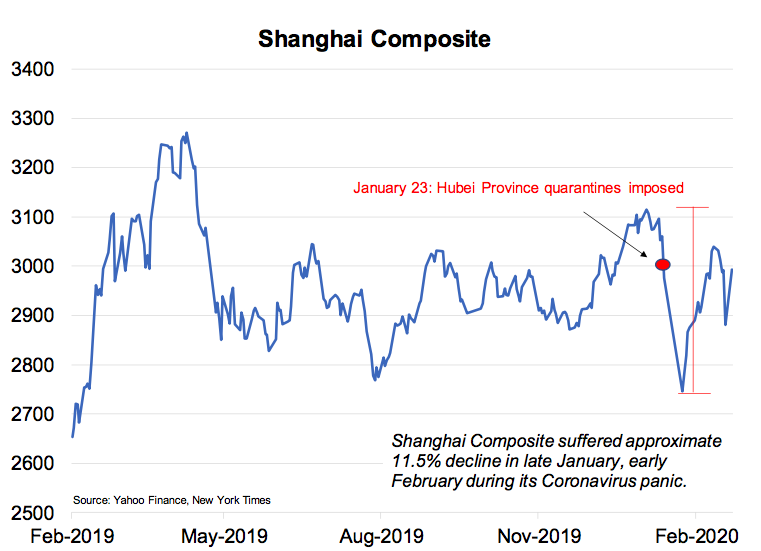
If we use January 23, 2020 (when the Chinese government imposed a lockdown in many parts of Hubei Province) as the start date, then perhaps we can say that it took China 1.5 months, at most, to succeed in controlling the virus. 

Considering that China reportedly imposed extreme measures to contain the virus, including bounties, the utilization of its government surveillance apparatus, and widespread quarantines, it’s possible that the rest of the world will require at least 1.5 months to control the virus and slow its infection rate.

Screen Shot 2020-03-10 at 9.21.38 AM.png

And what about US stocks? Will they crash more than they already have?

Between its high in mid-January to its low in early February, the Shanghai Composite sold off approximately 11.5% during its Coronavirus panic. And its rebound since then, has been fairly sustained. This is likely due to China’s success in containing the Coronavirus. It almost certainly helped, too, that the Chinese government implemented major monetary and fiscal policy measures, including interest rate cuts, the easing of loan terms to small and midsize businesses, and tax cuts.

It’s worth noting, as we mentioned last month, that we estimated the impact of SARS on the S&P 500 in 2002-2003 may have been as much as an 11% decline in the S&P 500.

These data points suggest that, with the S&P 500 -- as of March 3, 2020 -- being down nearly 11% from its highs, U.S. equities could find a bottom soon. I’m optimistic that it will, if it hasn’t already.

But, of course, this will likely be dependent on whether we see progress by authorities to contain the virus. Consequently, equity markets outside China during the near-term will likely be driven by headlines related to the containment and treatment of the virus.

Markets will also be reacting to any major, pro-growth economic measures; the exact features of which should determine the shape and slope of any market rebound, assuming the virus outside China is contained during the next couple months.

So far, the Federal Reserve has reduced the federal funds rate target by 50 basis points. Will it cut again soon? According to CBOE interest rate futures, the market is currently expecting nearly three more quarter point rate cuts by year-end. That’s ON TOP of the recent 50 basis points.

In addition to this monetary stimulus, will the White House and Congress work together to implement new tax cuts? If so, the exact tax cuts will mean everything. Will Larry Kudlow get the dream tax cut package that he and many other supply-siders have advocated for a long time: the indexation of capital gains for inflation? Or will any tax cut package be something more palatable to Democrats, such as a payroll tax cut or increased federal spending?

Economic Impact: Thinking about the Near-Term and Long-Term

Markets are suggesting that the economic cost of the Coronavirus will be massive. According to the Bloomberg Global Market Capitalization Index, global financial markets have lost nearly $10 trillion in value since their high in January, or nearly 11%. In my estimation, this may translate into a 50 basis point reduction in global GDP in 2020.

Notwithstanding the near-term GDP implications, the virus will likely have a major long-term impact on the global economic landscape, especially in accelerating the shift in supply chains away from China, as companies seek to diversify their suppliers and sources of material.

Also, the health crisis will likely mobilize more policymakers in Western countries to force certain manufacturing back into their home countries in the name of national security. While many headlines have highlighted potential supply disruptions in discretionary items such as electronics and household goods, other more non-discretionary goods are dangerously at risk of being in short supply in the West. For example, just yesterday, the Indian government restricted the export of 26 active pharmaceutical ingredients in an effort to stem possible drug shortages domestically.[viii] While many see the Coronavirus as something that we will get through, its implications will endure for many years to come.

Another Macro Implication from the Coronavirus: the November Election

Another macro implications to consider during this Coronavirus panic is whether it will have implications for the November elections. At one point last week, according to Rasmussen, President Trump suffered a 5-point drop in his approval rating (from 52% to 47%). This happened the day after his Wednesday February 26 press conference focused on the Coronavirus. Furthermore, for the week, between Monday February 24 and Friday February 28, the President’s reelection probability in Predictit betting markets declined from 59% to 55%. While President Trump remains the betting market favorite to win in November, there are clear indications that this virus poses a serious threat to his candidacy.

Screen Shot 2020-03-10 at 9.21.52 AM.png

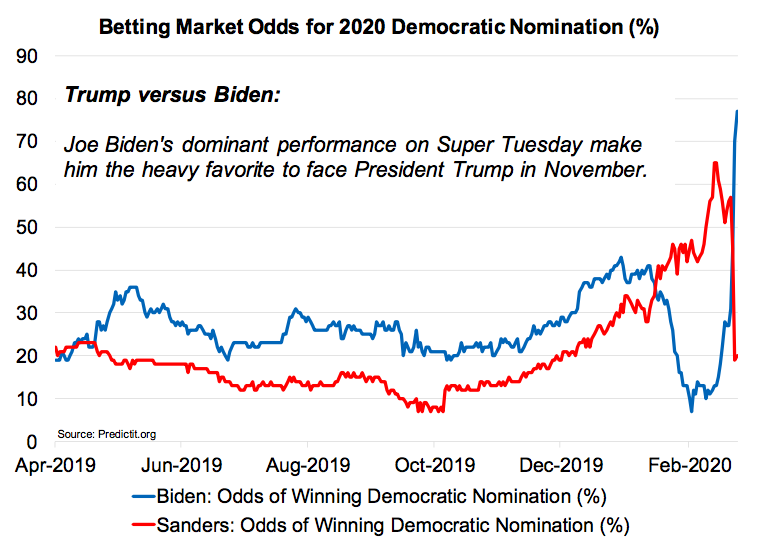
Meanwhile, the betting market on the Democratic presidential nominee is almost as erratic as stocks are these days. Today, the morning after the Super Tuesday primaries, Predictit bettors are giving Joe Biden a 77% chance of winning the nomination. Bernie Sanders’s chances have plummeted to 20%; a huge collapse from 60+% last month. It appears the turning point for Biden was his resounding win in the South Carolina primary as well as big surprise victories in Texas, Massachusetts and Minnesota. Clearly, the endorsements by Peter Buttigieg and Amy Klobuchar prior to Super Tuesday helped consolidate the moderate Democratic vote behind Biden; while Elizabeth Warren’s decision to stay in the race split the progressive vote from Sanders. Given how deeply divided the Democratic Party has been between moderates and progressives, perhaps the obvious path to build a bridge between both wings would be a Biden-Warren ticket. Predicit betting markets, however, have Kamala Harris as the current odds-on favorite to win the VP nomination at 20%, with Warren at 12%.

PKH Headshot - Sep 2015.jpg

Paul Hoffmeister is chief economist and portfolio manager at Camelot Portfolios, managing partner of Camelot Event-Driven Advisors, and co-portfolio manager of  Camelot Event-Driven Fund  (tickers: EVDIX, EVDAX).

*******

Disclosures:

•       Past performance may not be indicative of future results. Therefore, no current or prospective client should assume that the future performance of any specific investment, investment strategy (including the investments and/or investment strategies recommended by the adviser), will be profitable or equal to past performance levels.

•       This material is intended to be educational in nature, and not as a recommendation of any particular strategy, approach, product or concept for any particular advisor or client.  These materials are not intended as any form of substitute for individualized investment advice.  The discussion is general in nature, and therefore not intended to recommend or endorse any asset class, security, or technical aspect of any security for the purpose of allowing a reader to use the approach on their own.  Before participating in any investment program or making any investment, clients as well as all other readers are encouraged to consult with their own professional advisers, including investment advisers and tax advisors.  Camelot Portfolios LLC can assist in determining a suitable investment approach for a given individual, which may or may not closely resemble the strategies outlined herein.

•       Any charts, graphs, or visual aids presented herein are intended to demonstrate concepts more fully discussed in the text of this brochure, and which cannot be fully explained without the assistance of a professional from Camelot Portfolios LLC.  Readers should not in any way interpret these visual aids as a device with which to ascertain investment decisions or an investment approach.  Only your professional adviser should interpret this information.

Some information in this presentation is gleaned from third party sources, and while believed to be reliable, is not independently verified


[i] “Coronavirus: Italy reports 7 dead, 229 infected as Europe braces for COVID-19,” February 24, 2020, CNBC.

[ii] Ibid.

[iii] Ibid.

[iv] “Top CDC official tells Congress coronavirus almost qualifies as a global pandemic,” by Berkeley Lovelace Jr., March 3, 2020, CNBC.

[v] Ibid.

[vi] “In U.S. and Germany, Community Transmission Is Now Suspected,” February 26, 2020, New York Times.

[vii] “U.S. Coronavirus Infections Rise as Cases Outside China Pass 10,000,” by Jennifer Calfas and Jing Yang, March 3, 2020, Wall Street Journal.

[viii] “Europe ‘panicking’ over India’s pharmaceutical export curbs: industry group,” by Neha Dasgupta and Ludwig Burger, March 4, 2020, Reuters.

Coronavirus & Sanders: Jolt of Uncertainty

By Paul Hoffmeister


CoronaVirus: All about Treatment and Containment

The market outlook became much cloudier in late January due to the uncertainty caused by the Coronavirus outbreak and the recent surge by Bernie Sanders.

To paraphrase Frank Knight, the early 20th century University of Chicago economist, “risk” applies to situations where we do not know the outcomes but can reasonably measure the odds; whereas “uncertainty” applies to situations where we simply do not have sufficient information to confidently measure the odds.

Within this framework, one can easily argue that the Coronavirus epidemic in China created a textbook case of uncertainty. Where did the virus come from? How deadly would it be? And, how far would it spread?  

On January 23, 2020 Chinese authorities expanded travel restrictions imposed on the city of Wuhan to surrounding municipalities, shut down travel networks, and attempted to quarantine 25 million people.[i] What was considered by many as an epidemic localized in Wuhan suddenly became a potential global pandemic, evoking memories of SARS and Ebola.

As of the time of this writing, Johns Hopkins estimates that more than 20,000 people have been infected in 27 countries, with 427 dead. And according to CNBC, at least 24 Chinese provinces, municipalities and regions have told businesses not to resume work until February 10.[ii] This shutdown in Chinese production is huge, as these parts of the country account for more than 80% of China’s GDP.[iii]

One can see that accurately measuring the consequences of the Coronavirus – in terms of human and economic costs – can be exceedingly difficult, especially if the virus were to spread much more. Therefore, it’s not surprising that January 23rd, when this relatively contained epidemic seemed to begin morphing into a potential global pandemic, marked the recent peak in the S&P 500. On a closing basis, the S&P 500 traded at 3325.54 on Thursday January 23, and fell 3% to a low of 3225.52 on Friday January 31.[iv] 

Screen Shot 2020-02-07 at 11.20.35 AM.png

For some context for thinking about the market impact of a major, deadly viral outbreak, we estimate that the SARS and Ebola episodes in 2003 and 2004, respectively, led to approximately 5% to 11% selloffs in the S&P 500.

Screen Shot 2020-02-07 at 11.20.51 AM.png

The histories of the SARS and Ebola outbreaks as well as what we’re currently seeing with the Coronavirus suggest that the key questions for markets are: will the respective outbreak be relatively contained, and will the symptoms be mostly treatable? In the Knightian sense, concrete answers to these questions can transform highly immeasurable “uncertainty” into much more quantifiable “risk”. And that may be what we have been seeing recently.

While the human and economic costs of the Coronavirus have been massive, recent information offer some hope that this crisis will be contained.

First, effective treatment strategies may be on the way. For example, in Thailand, doctors have reported success in treating severe cases with a combination of anti-flu and anti-HIV medications.[v] Thailand’s health ministry has reported that a previously positive testing 71-year old patient tested negative for the virus after starting the combination.[vi] This news appeared to break on Sunday February 2, and in our view, may have been the key factor behind the strength in the S&P 500 beginning the next day. Then, on February 5, Sky News reported that a British scientist made a breakthrough in the race for a vaccine, which could reduce the development time from two to three years to just 14 days.[vii] The news appeared to further support the strength in equities this week.

Secondly, measures to contain the outbreak have been drastic. As most of us have seen, travel into and out of Hubei province has mostly stopped, and travel into and out of China has been significantly restricted. This may be the world’s largest quarantine in history. Additionally, the New York Times has reported that Chinese officials are utilizing the country’s vast surveillance network to track down infected citizens, as well as those that may have been near them; and even offering bounties of 1,000 yuan for each infected Wuhan person reported by residents.[viii] [ix] Leaving democratic and privacy principles aside, it’s possible that these extreme measures may be what financial markets want to see as far as containment is concerned.

While it took months for the SARS and Ebola outbreaks to get under control, and this will likely be the case with the Coronavirus, the improving outlook for treatment and containment should encourage financial markets going forward. We will almost certainly see infection counts and death tolls continue to rise during the near-term. But as long as treatment and containment continue to be effective, the rates of infection and death should ultimately crest.

The Bernie Rally 

The political market is increasingly eventful these days, and should be so as the primetime of the Democratic primaries happens during the next 60 days.

The big news is: Mayor Peter Buttigieg surprised many with his victory-by-a-nose in the Iowa Caucus, and former Vice President Joe Biden’s prospects to secure the nomination have plummeted. According to the Predictit betting market, Biden was being priced on January 8, at a 43% probability to win the Democratic presidential nomination. As of February 4, he traded at 20%.

But the biggest news in the political arena is the ascension of Bernie Sanders to front-runner status. Between January 8 and February 4, his odds on Predictit of securing the nomination jumped from 32% to 39%, with a high of 46% on February 2.

Screen Shot 2020-02-07 at 11.21.08 AM.png

Interestingly, the Bernie Rally seemed to ignite on January 24, after popular podcast host and UFC commentator Joe Rogan said on his podcast that he will “probably” vote for Sanders, after having interviewed him months ago.[x] The next day, Bernie’s Predictit odds jumped to a new high of 38% (from 34% on January 24), and his odds haven’t closed below 38% since. According to Slate, Rogan’s podcast was Apple Podcasts’ second most downloaded podcast in 2017 and 2018.[xi] Without a doubt, the landscape of political news and influencers has dramatically changed in recent years. 

The next two months may very well decide the Democratic nominee. New Hampshire is February 11, Nevada February 22, and South Carolina February 29. According to Predictit, the front-runners in each are, respectively, Sanders (at 83%), Sanders (66%), and Biden (60%).

Then “Super Tuesday” takes place on March 3, when nearly a third of all delegates are awarded; of which the biggest prizes are California and Texas with 415 and 228 delegates, respectively.[xii] Currently, Sanders is the front-runner in both states in the Predictit market.

January may turn out to be a major inflection point in the Democratic political market for the White House, with Sanders’s ascension and Biden’s plunge.

The consensus appears to be that President Trump is extremely pro-stock market, while Sanders may be the polar opposite. But what sectors will be most at-risk should Sanders win the general election in November? As we see it, Sanders could be especially negative for private prisons, gun manufacturers, student loan services, healthcare, private equity, and industries that benefit from a low minimum wage such as retail, leisure and hospitality.

We’ll likely see some movement or discounting in the stocks of these sectors during the coming months, especially if Sanders’s momentum continues. But, of course, one cannot easily assume Bernie Sanders will be president in 2021. Predictit is currently pricing in a 54% probability of a Republican winning in November; with Republicans likely keeping the Senate, and Democrats the House.

Paul Hoffmeister, Chief Economist, Camelot Portfolios, LLC

Paul Hoffmeister is chief economist and portfolio manager at Camelot Portfolios, managing partner of Camelot Event-Driven Advisors, and co-portfolio manager of Camelot Event-Driven Fund  (tickers: EVDIX, EVDAX).

*******


Disclosures:

•       Past performance may not be indicative of future results. Therefore, no current or prospective client should assume that the future performance of any specific investment, investment strategy (including the investments and/or investment strategies recommended by the adviser), will be profitable or equal to past performance levels.

•       This material is intended to be educational in nature, and not as a recommendation of any particular strategy, approach, product or concept for any particular advisor or client.  These materials are not intended as any form of substitute for individualized investment advice.  The discussion is general in nature, and therefore not intended to recommend or endorse any asset class, security, or technical aspect of any security for the purpose of allowing a reader to use the approach on their own.  Before participating in any investment program or making any investment, clients as well as all other readers are encouraged to consult with their own professional advisers, including investment advisers and tax advisors.  Camelot Portfolios LLC can assist in determining a suitable investment approach for a given individual, which may or may not closely resemble the strategies outlined herein.

•       Any charts, graphs, or visual aids presented herein are intended to demonstrate concepts more fully discussed in the text of this brochure, and which cannot be fully explained without the assistance of a professional from Camelot Portfolios LLC.  Readers should not in any way interpret these visual aids as a device with which to ascertain investment decisions or an investment approach.  Only your professional adviser should interpret this information.

•       Some information in this presentation is gleaned from third party sources, and while believed to be reliable, is not independently verified.

[i] “Chinese cities cancel New Year celebrations, travel ban widens in effort to stop coronavirus outbreak,” by Anna Fifield and Lean Sun, January 23, 2020, Washington Post.

[ii] “More than half of China extends shutdown over virus,” By Eveyln Chang, February 1, 2020, CNBC.

[iii] Ibid.

[iv] Source: Yahoo Finance.

[v] “Cocktail of flu, HIV drugs appears to help fight coronavirus: Thai doctors,” by Panu Wongcha-um, February 3, 2020, Reuters.

[vi] “Thailand Says New Drug Cocktail Successfully Treated Coronavirus in Chinese Patient in 48 Hours,” February 3, 2020, News18.com.

[vii] “British scientist makes breakthrough in race for coronavirus vaccine,” February 5, 2020, Reuters.

[viii] “China, Desperate to Stop Coronavirus, Turns Neighbor Against Neighbor,” by Paul Mozur, February 3, 2020, New York Times.

[ix] “China Sacrifices a Province to Save the World from Coronavirus,” by Claire Che, Dandan Li, Dong Lyu, Rachel Chang and Iain Marlow, February 4, 2020, Bloomberg News.

[x] “Podcast host Joe Rogan endorses Bernie Sanders,” January 24, 2020, Yahoo Finance.

[xi] “Joe Rogan’s Galaxy Brain,” by Justin Peters, March 21, 2019, Slate.

[xii] Source: New York Times

Thinking about 2020

By Paul Hoffmeister

With the charts in this month’s client letter, we try to put into perspective where stocks and bonds might be headed in 2020, and what factors may influence them. The general narrative of the S&P 500 and the 10-year Treasury yield in recent years may be boiled down to this:

In 2017, the S&P 500 rallied in a relatively consistent fashion due primarily to the tailwinds of major deregulation and tax cuts. The rally was interrupted in 2018 in large part by concerns over the Fed raising interest rates too aggressively, and in small part by the onset of the US-China trade conflict. The major reversal in Fed policy in early 2019 was the major macro story and catalyst of the year, a Fed officials shifted from signaling in late 2018 the possibility of two or three rate increases during 2019 to actually reducing the funds rate three times. Negative news from US-China trade negotiations in 2019 briefly worried stocks, but not significantly. During the last four months of the year, we experienced what appeared to be a major confluence of positive developments: a phase 1 US-China trade deal, clarity in the UK political and Brexit outlooks, major Fed intervention in the repo market and signals that it might hold the funds rate steady for a prolonged period of time.

As for the 10-year Treasury yield, strong economic data and hawkish signals from the Fed throughout 2018 pushed the yield to as high as 3.23% by November of that year. But emerging evidence of slowing growth, weak equities and then ultimately a pivot in Fed interest rate policy led to a major decline in the 10-year yield in 2019. It ended the year at approximately 1.92%.

As we look forward, the tailwinds are arguably at the market’s back in early 2020, particularly if the Federal Reserve does not raise interest rates this year (which we believe it likely), and remains more concerned about downside risks to the global economy.

As we see it, the US economy has downshifted into a lower gear compared to 2018. But we believe that growth should remain positive near a 1-2% annual growth rate. Although in August 2019, it appeared that the US economy was slowly drifting toward 0% GDP growth or less, the steepening of the yield curve since then has signaled that a recession during the next year is increasingly unlikely. Arguably, the strong employment environment is keeping the US out of recession. With the national unemployment rate at 3.5% as of November 2019, according to the US Bureau of Labor Statistics, we would need to see unemployment rise to at least 4.0% for us to get worried about the economy falling into negative GDP growth.

As we see it, with so many positive tailwinds surprising markets in 2019 (dovish Fed interest rate policy and repo market interventions, a partial US-China trade deal, and Brexit clarity) leading to major equity market gains, it will be much harder for the S&P to replicate its 2019 returns this coming year. A 10%-12% return in the S&P 500 appears to be more likely. And if the Fed remains neutral in its rate policy outlook, the 10-year Treasury yield could end 2020 between 2.00% and 2.25%.

The biggest uncertainties of 2020 appear to be geopolitical and political. Will the US-Iran variable escalate significantly, following the killing of Quds Force Commander Qasem Suleimani? And who will win the US presidential election in November, and what party will control Congress?

I suspect we may have seen the climax in US-Iran tensions in the near-term, after their retaliation against US bases in Iraq on January 7th and, importantly, President Trump does not seem to be re-escalating. But, it’s worth considering worth case scenarios. Saddam Hussein’s invasion of Kuwait in August 1990 may be a useful precedent to review. In the months following the invasion, which of course led to a US-led coalition driving Hussein’s forces back toward Baghdad in January 1991, the S&P 500 fell almost 17%, gold rallied nearly 12%, and West Texas intermediate crude sky-rocketed almost 87%.  Within this context, major market risks certainly exist should the US and Iranian militaries engage in all-out conventional warfare.

As for the political outlook, President Trump’s prospects to be reelected have risen steeply in recent months. Based on the Predictit betting market as of January 6th, the President had a 48% probability of winning in November, compared to 40% on October 9th. It’s hard to ignore the correlation between impeachment efforts and Trump’s improving chances during the last 90 days. Perhaps this is evidence of impeachment blowback, which arguably happened to Republicans in November 1998 after the Clinton impeachment events. Interestingly, the Democratic frontrunners today are former Vice President Joe Biden and Senator Bernie Sanders. Senator Warren prospects have seemingly plummeted in recent months, after taking relentless heat for her Medicare For All plans. 

Screen Shot 2020-01-14 at 11.45.29 AM.png

Neutral Fed policy may be the most important macro variable of 2020, which could allow stocks to continue drifting higher.

Screen Shot 2020-01-14 at 11.45.44 AM.png

Neutral Fed policy could keep a “lid” on interest rates in 2020.

Screen Shot 2020-01-14 at 11.46.09 AM.png

The inverting yield curve in summer 2019 suggested that the US economy was heading toward 0% GDP growth or less. The steepening curve since then is a relief.

Screen Shot 2020-01-14 at 11.46.38 AM.png

Despite the steepening Treasury curve that may be signaling a lower probability of recession in the United States, the economy seems to be stuck in a lower gear at the moment. The heyday economy of 2017-2018 may have been squashed by higher interest rates and other major macro uncertainties, including the US-China trade row and Brexit concerns.

Screen Shot 2020-01-14 at 11.47.03 AM.png

We aren’t worried about a recession occurring during the next year as long as the job market remains strong. Based on the Sahm Recession Indicator, we’d start getting worried if we saw the national unemployment rate jump to at least 4%, from the recent 3.5% level.

Screen Shot 2020-01-14 at 11.47.26 AM.png

How much downside in the S&P 500 would there be if the United States and Iran engaged in an all-out conventional war? Impossible to predict. But the nearly 17% decline in the stock index in 1990 may be a useful precedent to consider.

Screen Shot 2020-01-14 at 11.47.57 AM.png

Gold jumped nearly 12% as geopolitical uncertainty skyrocketed after Saddam Hussein’s invasion of Kuwait and a US-led military coalition was being assembled for war.

Screen Shot 2020-01-14 at 11.48.21 AM.png

Oil seems to have had one of the most pronounced price reactions to the invasion of Kuwait and the lead-up to the first Iraq War.

Screen Shot 2020-01-14 at 11.48.45 AM.png

Will President Trump be re-elected? According to Predictit betting markets, Trump is the clear front-runner to win the 2020 presidential election. Biden and Sanders are in a distant second and third place, respectively.

PKH Headshot - Sep 2015.jpg

Paul Hoffmeister is chief economist and portfolio manager at Camelot Portfolios, managing partner of Camelot Event-Driven Advisors, and co-portfolio manager of Camelot Event-Driven Fund  (tickers: EVDIX, EVDAX).


******

Disclosures:

•       Past performance may not be indicative of future results. Therefore, no current or prospective client should assume that the future performance of any specific investment, investment strategy (including the investments and/or investment strategies recommended by the adviser), will be profitable or equal to past performance levels.

•       This material is intended to be educational in nature, and not as a recommendation of any particular strategy, approach, product or concept for any particular advisor or client.  These materials are not intended as any form of substitute for individualized investment advice.  The discussion is general in nature, and therefore not intended to recommend or endorse any asset class, security, or technical aspect of any security for the purpose of allowing a reader to use the approach on their own.  Before participating in any investment program or making any investment, clients as well as all other readers are encouraged to consult with their own professional advisers, including investment advisers and tax advisors.  Camelot Portfolios LLC can assist in determining a suitable investment approach for a given individual, which may or may not closely resemble the strategies outlined herein.

•       Any charts, graphs, or visual aids presented herein are intended to demonstrate concepts more fully discussed in the text of this brochure, and which cannot be fully explained without the assistance of a professional from Camelot Portfolios LLC.  Readers should not in any way interpret these visual aids as a device with which to ascertain investment decisions or an investment approach.  Only your professional adviser should interpret this information.

•       Some information in this presentation is gleaned from third party sources, and while believed to be reliable, is not independently verified.

2019: The Year of the Fed and China Variables

By Paul Hoffmeister, Chief Economist

During the first week of 2019, we explained that our base case stock market scenario this year was for a 15% return in the S&P 500. So far, the S&P 500 has rallied more than 23%, not including dividends.[i] To us, the key driver of equities this year has been strongly dovish Fed policy, which has seemingly confirmed the adage: “Don’t fight the Fed.”

Arguably, the most important distinguishing feature between December 2018 and December 2019 is the fact that a year ago, many FOMC members were telegraphing two to three rate increases during 2019, whereas the reality has been that the FOMC has actually reduced the funds rate this year by three quarter points. In other words, rather than the funds rate going up in 2019 from a 2.25-2.50% range to 3.00-3.25%, the funds rate has DECLINED to 1.50%-1.75%.

And indeed, on January 4th after weeks of market panic, Chairman Powell saying that the Fed would be “patient” in raising rates appeared to mark the critical inflection point for the policy outlook and stocks have seemingly never looked back.

As such, we’ve seen a major U-turn in Fed thinking this year from one focused on slowing growth because of inflation fears, to one focused on supporting growth in the face of myriad macroeconomic risks, including the slowing global economy and trade frictions.

Notwithstanding, this year’s stock market performance has been ostensibly unremarkable or even boring, with the S&P 500 gradually floating higher for most of 2019. The Fed-catalyzed stock market rally was, for the most part, meaningfully interrupted only twice with the small selloffs in May and August. Both of those episodes appeared to have been sparked by negative news related to the US-China trade conflict.

Interestingly, when one looks deeper into the market behavior of 2019, the negative US-China trade news in May and August appeared to have also caused the Treasury curve to invert; while the announcement of a “Phase One” trade deal on October 11 appeared to cause the curve to steepen. This impact of the US-China trade variable on the Treasury curve suggests that these trade negotiations are having an important impact on economic growth at the margin.

Screen Shot 2019-12-10 at 7.18.47 AM.png

Unfortunately, the US-China trade conflict doesn’t seem like it will be completely resolved anytime soon. The supposed Phase One deal announced in October has yet to be consummated, even though it was scheduled to be finalized in November. Even more worrisome, Phase One arguably encompassed many of the easiest aspects of the disagreement to be resolved. If this was supposed to be the easy part, how long will Phases Two and Three take to complete?

The recent comments from President Trump signaling that a trade deal may not happen until after the 2020 elections supports a pessimistic outlook for this variable. The remark may well be a late stage negotiating tactic to complete the Phase One deal. Or it could be a sign that, in fact, Beijing and Washington are so far apart on a deal that we are a long ways from any meaningful resolution. I believe both are true: this is negotiation, and there is serious disagreement about major trade issues that will require years to be resolved comprehensively. The best case scenario for this variable in 2020 could be that a Phase One deal is reached, and both sides maintain a constructive dialogue throughout the year.

With the US and China in a protracted trade conflict, we should expect the uncertainty and the reorganizing of global supply chains to weigh on global economic activity during the near-term.

Why would companies invest billions in new capital investment if supply chains are at risk and economies appear to be slowing? Unfortunately, too, this may be an environment that continues to put the entrepreneurial segment of the global economy at a great disadvantage relative to the largest companies that have more capital and “business moats” to weather economic uncertainty. This is unfortunate because arguably entrepreneurs and small businesses are the lifeblood of a thriving, dynamic economy.

This cautious view of near-term economic conditions appears to be underscored by the fact that some credit spreads have not fully “healed” (i.e. narrowed) to where they were in late 2017, early 2018 – before the trade conflict erupted.

For example, according to the St. Louis Federal Reserve, the Baa-Aaa spread currently trades at approximately 91 basis points, compared to a relatively tight spread of 65 to 70 basis points in late 2017, early 2018. As I see it, a wide or widening spread reflects higher risk aversion and less economic growth; whereas a tight or tightening spread reflects less risk aversion and less growth.

Even though this spread has narrowed since early 2019 from more than 120 basis points, investors are not willing to pay up to the same degree that they did two years ago for assuming the additional investment risk. In our view, this makes sense: two years ago the economy was accelerating to a nearly 3% GDP rate (year-over-year), whereas today it simply does not have the same horsepower with GDP likely growing less than 2%.[ii]

Something is restraining the global economy. While volatile currencies and growth-inhibiting tax rates are a pervasive problem, the US-China trade conflict may be the most acute issue.

Screen Shot 2019-12-10 at 7.19.24 AM.png

In summary, this year’s “risk on” rally in equities and the Fed’s U-turn on interest rates are much welcomed. And, a dovish Fed posture next year will be extremely important, and likely creating a nice tailwind for risk assets. But the outlooks for growth and risk are not as strong as the 2019 rally might suggest, and it may be due to US-China trade uncertainty. For as long as the trade conflict persists, it should act as a governor on animal spirits and risk-taking. Therefore, it’s likely that one of the most important catalysts for financial markets in 2020 -- beside Fed policy -- will be trade. It could determine whether we have another strong equity market performance or whether we have an eruption of panic about commerce between the world’s two largest economies and the resultant fallout from even slower growth. We’re marking December 15th on our calendars. This is the deadline that President Trump has set for another round of tariffs on Chinese imports, which could certainly happen if Phase One isn’t finally completed.

PKH Headshot - Sep 2015.jpg

Paul Hoffmeister is chief economist and portfolio manager at Camelot Portfolios, managing partner of Camelot Event-Driven Advisors, and co-portfolio manager of  Camelot Event-Driven Fund  (tickers: EVDIX, EVDAX).


*******

Disclosures:

•       Past performance may not be indicative of future results. Therefore, no current or prospective client should assume that the future performance of any specific investment, investment strategy (including the investments and/or investment strategies recommended by the adviser), will be profitable or equal to past performance levels.

•       This material is intended to be educational in nature, and not as a recommendation of any particular strategy, approach, product or concept for any particular advisor or client.  These materials are not intended as any form of substitute for individualized investment advice.  The discussion is general in nature, and therefore not intended to recommend or endorse any asset class, security, or technical aspect of any security for the purpose of allowing a reader to use the approach on their own.  Before participating in any investment program or making any investment, clients as well as all other readers are encouraged to consult with their own professional advisers, including investment advisers and tax advisors.  Camelot Portfolios LLC can assist in determining a suitable investment approach for a given individual, which may or may not closely resemble the strategies outlined herein.

•       Any charts, graphs, or visual aids presented herein are intended to demonstrate concepts more fully discussed in the text of this brochure, and which cannot be fully explained without the assistance of a professional from Camelot Portfolios LLC.  Readers should not in any way interpret these visual aids as a device with which to ascertain investment decisions or an investment approach.  Only your professional adviser should interpret this information.

•       Some information in this presentation is gleaned from third party sources, and while believed to be reliable, is not independently verified.

[i] Source: Dow Jones.

[ii] Source: Bureau of Economic Analysis

Big Things in October. What Next?

By Paul Hoffmeister, Chief Economist


November 7, 2019

As we stated last month, important news about US-China trade, Brexit, and the Fed was due in October that had the potential to move markets significantly. The good news is, markets received positive information concerning these variables, sparking a strong stock market rally during the month.

On October 11, it appeared that the US and China had agreed to what was dubbed a “phase one trade deal”. According to President Trump, the Chinese government agreed to increase purchases of US agricultural commodities, certain intellectual-property measures and concessions related to financial services and currency.[i] In exchange, an increase in tariffs on Chinese imports was delayed.

Then, on October 17, European Commission President Jean-Claude Juncker tweeted, after heated negotiations with Prime Minister Boris Johnson over Brexit: “We have [a deal]! It’s a fair and balanced agreement for the EU and the UK to our commitment.”[ii] While the deal did not ultimately receive approval from the British Parliament, it appeared to have reduced the odds of a no-deal Brexit in the future. Underscoring the importance of the perceived breakthrough in this variable, the British pound rallied in October from a low around 1.22 dollars per pound to a high of nearly 1.30 – an especially large swing in one of the world’s largest currencies.[iii] Nonetheless, the Brexit issue is not yet resolved completely. The UK will hold a general election on December 12, meaning that the question of Brexit and its specific outlines will be left to the voters once again.

Finally, on October 30th, the Federal Open Market Committee announced an interest rate cut for the third time this year, nearly reversing its four rate increases in 2018. Note, the three rate cuts so far this year is a vastly different scenario than what FOMC officials were telegraphing late last year for 2019, when they contemplated two to three rate INCREASES. As such, the federal funds rate now trades at a range between 1.50% and 1.75%, as opposed to what was possibly going to be 3.00%-3.25% today.

While Fed policymakers recently expressed concerns about slowing global growth and uncertainties surrounding trade and Brexit, there also appeared to be a major change in their perspective about the general price level, from fear in 2018 of inflation to a fear today of unacceptably low inflation. The Fed is now, importantly, more accommodative and arguably more in-line with what equity markets want or expect.

As we see it, the confluence of positive news on trade, Brexit and Fed policy ultimately translated into a more than 5% rally in the S&P 500 in October -- when measuring between its October 2nd closing low of 2887.61 and its close of 3037.56 at month-end.[iv]

Screen Shot 2019-11-12 at 3.35.04 PM.png

The major macro developments of recent weeks also appear to have relieved the concerns seemingly priced into credit markets, as the US Treasury curve significantly steepened out of the inversion we saw during the late summer.

After reaching a low of nearly -50 basis points in late August, the spread between 3-month and 10-year Treasuries is now nearly +30 basis points.[v] As readers know from our writings in recent years, the almost persistent flattening and then inverting of the Treasury curve during 2018 and 2019 was increasing the odds of a future recession based on the New York Federal Reserve’s yield curve/recession model. The major steepening in recent months has alleviated the concern over an imminent recession.

With many fears and uncertainties sorted out during the last month, we can breathe a sigh of relief, at least for now. The Fed is no longer trying to slow growth with interest rate increases; there’s less fear about the UK crashing out of the European Union; and relations between Washington and Beijing are, at least, still constructive.

Notwithstanding, there are still important questions and potential dangers ahead.

The questions at the top of my mind are the following: At what point will the Fed no longer be accommodative? What happens to US-China relations after any phase 1 trade deal is signed? Will the British voters give Boris Johnson a clear mandate on December 12 to complete the Brexit deal he has negotiated? Does the Trump impeachment push have any legs to it? Who will win the 2020 presidential election, and what will that mean for future US economic and foreign policies?

The Fed: The last time the Fed made a “mid-cycle” adjustment (if in fact we are in a mid-cycle adjustment phase today) was in September 1998 when it started to cut the fed funds rate from 5.50% to 4.75% in November 1998. Those rate cuts seemed to prop up stock prices and steepen the yield curve, similar to this year’s cuts. It’s noteworthy, however, that the Fed then reversed course and restarted its rate-hiking campaign by June 1999, raising the funds rate from 4.75% to 6.50% by May 2000. If that episode is analogous to today, then the Fed’s present dovish policy posture may be short-lived, perhaps only six to nine months. With many of today’s Fed policymakers concerned in recent years about low unemployment creating inflation risks and stock market highs creating investment bubbles, it will be important to note whether those views re-emerge in the coming months.

But, for now, the Fed policy outlook appears favorable. As Chairman Powell said during his October 30 press conference: “The reason why we raise interest rates, generally, is because we see inflation as moving up, or in danger of moving up significantly, and we really don’t see that now.”[vi]

US-China Trade: In recent days, rumors have emerged that the signing of the phase one deal could be delayed to December. According to Reuters, Beijing wants Washington to drop the 15% tariffs on $125 billion worth of Chinese goods that went into effect on September 1, AS WELL AS a reduction in the 25% tariffs imposed on approximately $250 billion of imports including semiconductors, machinery and furniture.[vii] Reportedly, the White House wants strong language in an agreement related to enforcement mechanisms related to intellectual property theft.

As I see it, this is last minute horse-trading where the important details of the phase one deal will be worked out. Given that the phase one deal is only a partial one and doesn’t touch on other major areas of disagreement (such as Chinese subsidies to state-owned enterprises and easing controls over the internet), it’s unlikely that the White House will roll back most of its tariffs. Arguably, the main leverage that the White House wields in the negotiations are tariffs and black-listing major Chinese companies from doing business in the United States. But, at the moment, it’s likely that a sufficient number of tariffs will be rescinded, and a partial deal will still be reached.

Nonetheless, there is still a long way to go in the trade dispute between the US and China. Quite possibly, this will go on for many years. The issues in the phase one deal could be the easiest issues to resolve.

UK Elections & Brexit: According to a YouGov survey between October 17 and 28, Boris Johnson’s Conservative Party leads with 36% of voters, then Labour with 22%, Liberal Democrats 19%, and Brexit 12%.[viii] Consequently, the December 12 general election looks like Johnson’s to lose. If the Tory’s give up that lead to Labour and Liberal Democrats, then Brexit may not happen anytime soon. Conversely, if Tory’s give up the lead to the Brexit Party, we could see another stalemate with the EU, as the future government will be pressured to be even more aggressive in negotiating another deal.

Trump Impeachment: On October 31, the House passed a more formal process related to impeachment. In the weeks ahead, six different House committees will continue their investigations into the Trump Administration, which will include public hearings as well as closed-door depositions. The first public hearings will be held during the week of November 11.

Predicit betting markets are currently pricing in a 40% probability of a Trump impeachment by year-end 2019, and 78% probability by the end of his first term.

Perhaps the most important aspect to a possible impeachment will be whether Republican senators stay united in their opposition against the removal of the President. Notably, on November 5th, Senate Majority Leader Mitch McConnell said, “I’m pretty sure how [an impeachment trial] is likely to end. If it were today, I don’t think there’s any question, it would not lead to a removal.”[ix]

If we see Republican senators begin to support impeachment and voting to remove President Trump, the S&P 500 could be vulnerable to a significant decline.

As we’ve pointed out before, we believe the events leading up to President Clinton’s impeachment contributed to a nearly 15% selloff in the S&P 500, specifically between the time of the Lewinsky plea deal and the release of the Starr Report when the clouds were arguably the darkest for Clinton. With regard to President Nixon’s impeachment and ultimate resignation, between November 1, 1973 when Leon Jaworski was appointed special prosecutor and August 8, 1974 when Nixon resigned, the S&P 500 fell approximately 25%.

At the moment, it seems that markets are not overly concerned about the prospect of a Trump removal. If that changes, we could see major equity market weakness.   

2020 Presidential Election: According to Predictit betting markets, Senator Warren’s chances of winning the Democratic nomination have fallen significantly from approximately 52% on October 4, to 33% on November 4.

Nonetheless, she remains the favorite to win the nomination. On the same day, former Vice President Biden traded at 22%, Mayor Buttigieg at 19%, and Senator Sanders at 14%. Interestingly, although she has not entered the race, Senator Clinton traded at 9%.

It appears that Warren’s collapse can be attributed to her unconvincing answers related how to pay for her Medicare-For- All plan. It seemed quite clear that her opponents viewed that issue as her weakest flank, and they attacked it aggressively during the last month.

The race for the Democratic nomination could be a long one. At the moment, it seems that the party is divided between the populist left platform represented by Warren and Sanders (with a collective 47% probability of either of them winning the nomination), and the moderate left represented by Biden-Buttigieg-Clinton (with a 50% probability).

Interestingly, in a recent New York Times/Siena College poll, Joe Biden leads or is even with President Trump in five out of six key swings states (Arizona, Florida, Michigan, North Carolina, Pennsylvania and Wisconsin).[x] Whereas Sanders and Warren, lead or are even with Trump in three of those six states.[xi] With the party so divided and Biden looking politically weakened by the attacks from his Democratic and Republican rivals in recent months, it is understandable that Hillary Clinton might see an opportunity to enter the race.

With the Iowa Caucuses scheduled for February 3, the next three months are a political eternity, where anything could happen in the race for the Democratic nomination.

Conclusion: I believe the major reversal in Fed policy, from effectively telegraphing a 3.00%-3.25% funds rate in late 2018 to now having a 1.50%-1.75% funds rate, contributed substantially to the 20+% appreciation in the S&P 500 this year. Despite the major uncertainties with US-China trade, Brexit and US politics, this year may be another example to support the axiom: “Don’t Fight the Fed”.

Using the same logic, the next year’s worth of equity returns will likely not be as easy. The Fed appears to be now on a more neutral footing. And if the Fed were to cut during the next year, it will likely be in response to new economic negatives. But, if policymakers can simply “do no harm”, then the global economy should begin to stabilize in the coming months; and certainly, more positive news with regard to trade, Brexit and US politics will help.

With the macroeconomic outlook appearing to be much better today, a “risk-on” investment approach makes sense. However, many significant questions and issues still exist, suggesting that we’re not out of the woods yet. The most market friendly scenario in coming months would appear to be a dovish Fed, political stability in the US, a clear path to Brexit (finally!), and more constructive dialogue and progress between the US and China. The bear market scenario could well include one or more of these variables going horribly wrong.


Paul Hoffmeister is chief economist and portfolio manager at Camelot Portfolios, managing partner of Camelot Event-Driven Advisors, and co-portfolio manager of Camelot Event-Driven Fund  (tickers: EVDIX, EVDAX).


*******

Disclosures:

•       Past performance may not be indicative of future results. Therefore, no current or prospective client should assume that the future performance of any specific investment, investment strategy (including the investments and/or investment strategies recommended by the adviser), will be profitable or equal to past performance levels.

•       This material is intended to be educational in nature, and not as a recommendation of any particular strategy, approach, product or concept for any particular advisor or client.  These materials are not intended as any form of substitute for individualized investment advice.  The discussion is general in nature, and therefore not intended to recommend or endorse any asset class, security, or technical aspect of any security for the purpose of allowing a reader to use the approach on their own.  Before participating in any investment program or making any investment, clients as well as all other readers are encouraged to consult with their own professional advisers, including investment advisers and tax advisors.  Camelot Portfolios LLC can assist in determining a suitable investment approach for a given individual, which may or may not closely resemble the strategies outlined herein.

•       Any charts, graphs, or visual aids presented herein are intended to demonstrate concepts more fully discussed in the text of this brochure, and which cannot be fully explained without the assistance of a professional from Camelot Portfolios LLC.  Readers should not in any way interpret these visual aids as a device with which to ascertain investment decisions or an investment approach.  Only your professional adviser should interpret this information.

•       Some information in this presentation is gleaned from third party sources, and while believed to be reliable, is not independently verified.


[i] “Trump Touts US-China Phase One Trade Deal, Delays Tariffs,” by Jennry Leonard, Saleha Mohsin and Shawn Donnan, October 11, 2019, Bloomberg.

[ii] “UK, EU Reach Brexit Deal – Now Comes the Hard Part,” October 17, 2019, The Associated Press.

[iii] Source: St. Louis Federal Reserve.

[iv] Source: Yahoo Finance.

[v] Source: St. Louis Federal Reserve.

[vi] “The Fed’s View on Inflation Is Quietly Shifting. Here’s Why,” by Jeanna Smialek, November 1, 2019, New York Times.

[vii] “US-China Trade Deal Signing Could Be Delayed Until December – US Sources,” by David Brunnstrom and Matt Spetalnick, November 6, 2019, Reuters.

[viii] “These Four Charts Show How the UK Election, and Brexit, Could Play Out,” by Holly Ellyatt, November 7, 2019, CNBC.

[ix] “Mitch McConnell: A Senate Impeachment Trial ‘Would Not Lead to a Removal,” by NBC News, Youtube.

[x] “Trump Is Competitive in Six 2020 Swing States Despite National Weakness, Polls Say,” by Jacob Pramuk, November 4, 2019, CNN.

[xi] Ibid.