by Paul Hoffmeister, Portfolio Manager and Chief Economist
The first FOMC meeting under Chairman Kevin Warsh suggested that significant reforms to the Federal Reserve's policy framework, communications practices, and operating procedures may be on the horizon.
In his post-meeting statement, he revealed the formation of five task forces to deal with communications, the balance sheet, data, productivity and jobs, and the Fed’s inflation framework. The task forces will be comprised of both Fed and outside experts, with conclusions planned by year-end.
Warsh also did not contribute his own dot plot forecasts for the fed funds rate in the Summary of Economic Projections (“SEP”). This is somewhat consistent with his criticisms during confirmation hearings about frequent forward guidance by the central bank. From Warsh’s perspective, frequent guidance can constrain Fed decision-making.
More broadly, Warsh's actions suggest an effort to reduce the Federal Reserve's reliance on forward guidance. The combination of an unusually brief policy statement, his decision not to submit SEP projections, and the creation of a communications task force point toward a philosophy that monetary policy should be driven by incoming economic data rather than detailed promises about future policy paths. If sustained, this would represent one of the most meaningful changes to Fed communications since the Global Financial Crisis.
As for actual policy, the FOMC released an unusually brief statement announcing that it would maintain the current fed funds target range at 3.50%-3.75%. The statement’s concluding paragraph was seemingly curt and straight to the point: “Inflation remains elevated relative to the Committee's 2 percent goal, in part reflecting supply shocks that have driven price increases in certain sectors, including energy. The Committee will deliver price stability.”
Given its assessment of economic growth and labor market conditions, the FOMC appears to view the balance of risks as tilted more toward inflation than labor market weakness.
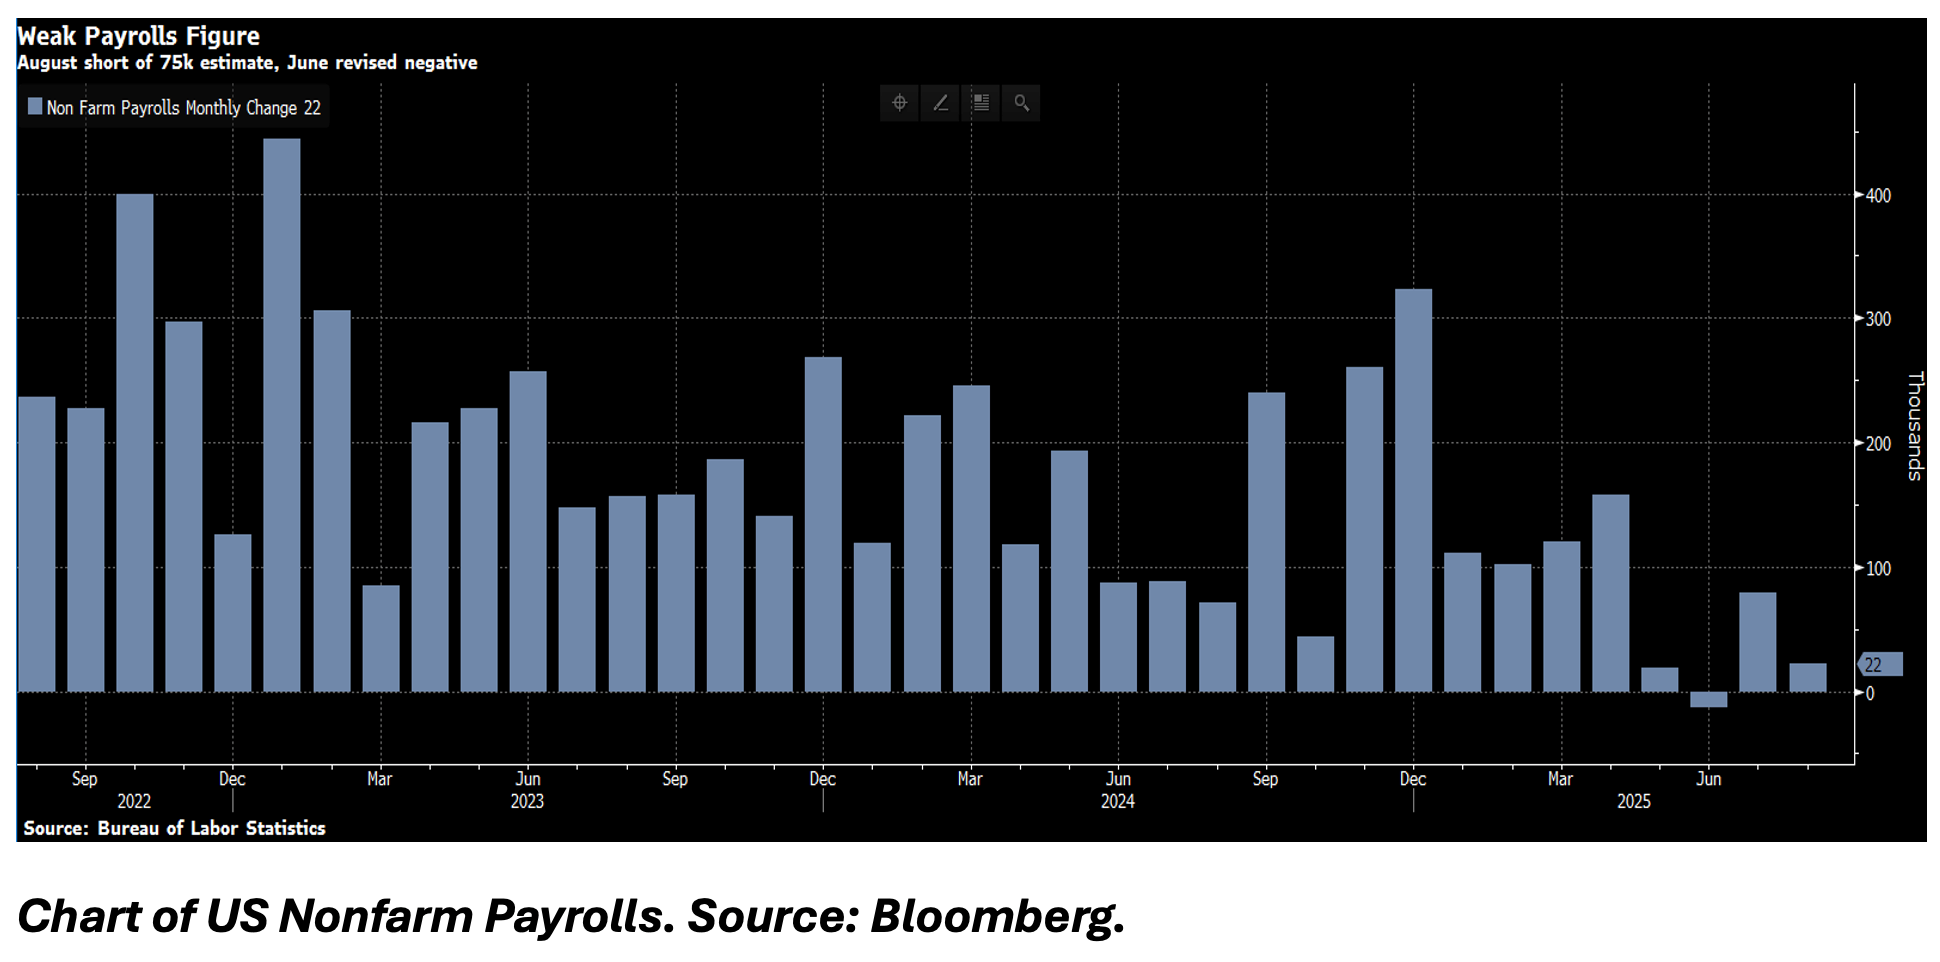
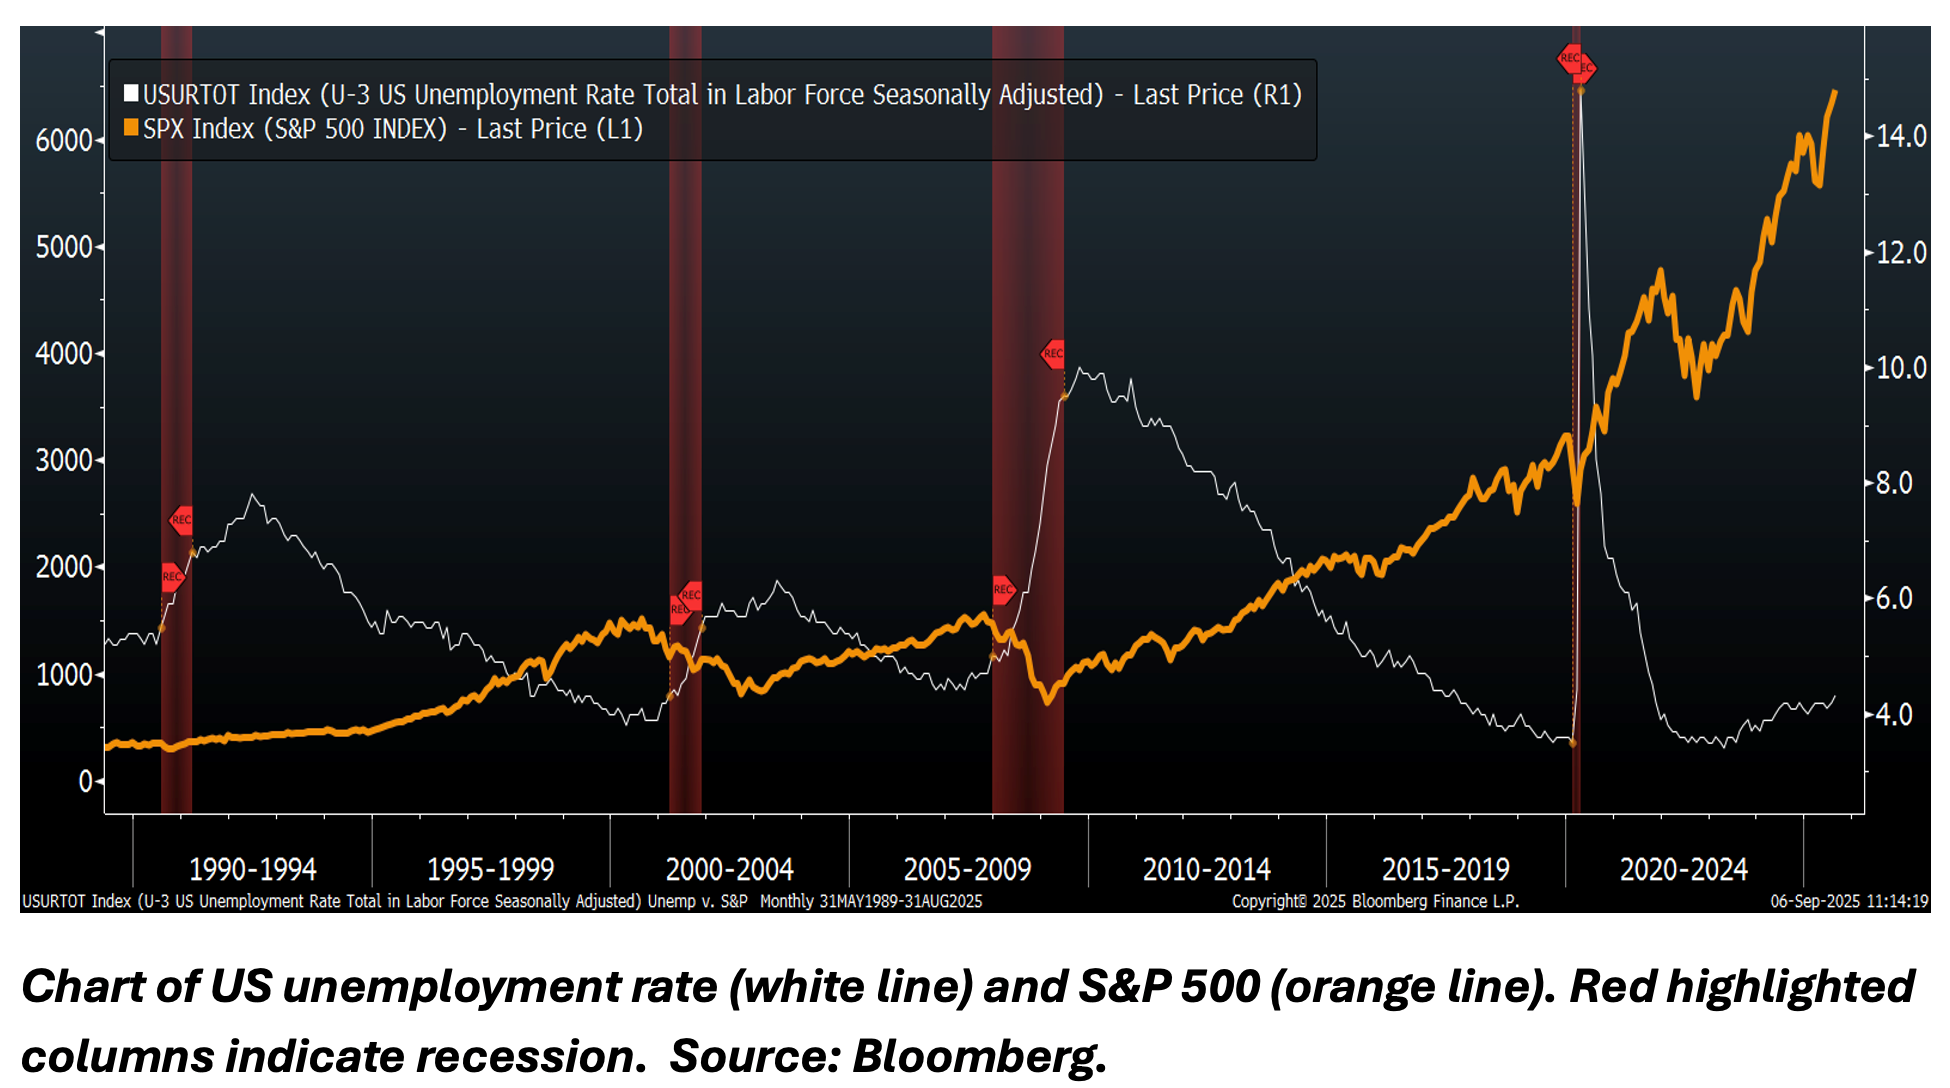
According to the FOMC statement: “economic activity is expanding at a solid pace”; “productivity growth and capital investment are strong”; “job gains have kept pace with the workforce”; and “the unemployment rate has changed little”. Meanwhile, according to the Bureau of Labor Statistics, year-over-year headline CPI increased 4.1% in May, while core CPI increased 2.9%.
Following the FOMC announcement and Warsh’s press conference, the S&P 500 fell, the 10-year Treasury yield rose, and gold prices declined – which we interpret to be a decidedly hawkish market reaction. And as of Tuesday June 23, CME Fed Watch suggested a greater than 85% probability of at least one rate hike by year-end, which if that occurred would mark the end of the current rate-cutting cycle.
To us, the most notable policy signal in the post-meeting press conference was Warsh’s emphasis on inflation. He said, “Inflation has been running well ahead of the Fed’s long-stated inflation goal of 2%. That’s been going on for more than five years.” This statement is arguably a strong reassertion of the Fed’s 2% inflation target.
In our view, Chairman Warsh used his first FOMC meeting to send a clear message. The Fed appears to have removed its easing bias, reaffirmed its commitment to restoring price stability, and begun laying the groundwork for broader institutional reforms. For investors expecting a near-term return to easier monetary policy, last Wednesday's meeting suggested that the "higher for longer" era may have further to run.

Paul Hoffmeister is Chief Economist and Portfolio Manager at Camelot Portfolios, managing partner of Camelot Event-Driven Advisors (CEDA), and co-portfolio manager of the Camelot Event-Driven Fund (EVDIX • EVDAX).
WANT MORE WAYS TO STAY UP-TO-DATE
ON ALL THE EVENT-DRIVEN NEWS?
https://www.linkedin.com/company/camelot-event-driven-advisors
Camelot Event-Driven Advisors LLC | 1700 Woodlands Drive | Maumee, OH 43537
All investing carries with it risk, including the risk of loss, that investors should be prepared to bear. This material is for educational use only and is not intended to be construed as investment advice. Readers or participants in an oral presentation of these materials should consult with their own personal financial, tax, legal and other advisors before making any decision to make any investment, including any investment believed to be related to the topics of these materials. The discussion herein, while based on current economic data, may or may not lead to the outcomes presented, express or implied. Economic conditions, even in a single sector, are subject to an unknown number of variables, the totality of which are impossible to predict or account for in analytical assumptions. Past performance does not necessarily lead to future results. Specifically, trends in economic data do not always, and frequently do not, continue as expected. B747
Copyright © 2026 Camelot Event-Driven Advisors LLC, All rights reserved.
Copyright © 2026 Camelot Portfolios LLC, All rights reserved.