Rosy Outlook, Unfavorable Risk-Reward

by Paul Hoffmeister, Portfolio Manager and Chief Economist

At the end of October, we advised clients that betting markets were expecting Republicans to retake the White House and Senate, and that the biggest election uncertainty was whether they’d be able to hold on to the House of Representatives. Case in point, Polymarket was giving Republicans only a 51% probability to keep the House at the time, compared to 65% and 84% to win the presidency and Senate, respectively. Lo and behold, Republicans breezed through most of Election Night but their toughest challenge was winning the House, where they secured 220 seats for only a 5-seat majority – one of the narrowest in history. 

The slim House majority will make President Trump’s economic agenda a little more difficult to implement. Every vote will matter, and some legislators might view this as an opportunity or “leverage” to hold out for their favorite issues. But Administrations that sweep the White House and Congress typically enjoy enough political momentum to craft their preferred legislation early in their term. So, we expect the incoming Trump Administration will get key economic legislation passed and implemented during the first six months of 2025. 

President Trump will pursue an economic agenda propelled by tax cuts, making government more efficient and business-friendly, and rebalancing trade flows based on new tariff arrangements. 

This agenda will very likely start with making permanent President Trump’s 2017 tax cuts, which notably reduced the corporate tax rate (to 21% from 35%) as well as marginal income tax rates. Given that those tax cuts are scheduled to expire at the end of 2025, this will be important to accomplish quickly; not simply because of their expiry date but also to re-enliven animal spirits in an economy that seems to be slowing at the margin.

At the same time, we expect the new Administration, namely under Elon Musk and Vivek Ramaswamy through the newly created Department of Government Efficiency (“DOGE”), to aggressively pursue its government efficiency agenda. Their objective will be to identify and excise unnecessary government largess, while also eliminating excessive regulatory burdens on the private sector. In some respects, DOGE will be similar to Trump’s first-term deregulation efforts, but with additional emphasis on reducing government expenditures in light of the ever-growing federal deficit.  

And, of course, there will be new tariff measures or at least threats thereof; the purpose of which will be to rebalance trade flows in favor of the United States and/or compel foreign countries to act on specific issues. Already, we’ve seen President Trump threaten through social media new tariffs against Canada and Mexico unless those countries assisted with his new immigration agenda. 

Of course, China is in Trump’s crosshairs, and we don’t believe that this trade dispute will be resolved anytime soon. If recent events are any indication, then this variable will likely worsen before it improves. 

On December 2, the Biden Administration introduced new controls on semiconductor manufacturing equipment and software tools to limit China’s ability to produce advanced semiconductors. The following day, seemingly in retaliation, China announced its own export restrictions against the United States related to dual-use technologies for civil and military use, including controls on rare earth minerals. This was the first time that China specifically targeted certain exports against the United States, as opposed to all countries. These tit-for-tat measures by both sides exemplify the escalating tech trade war.

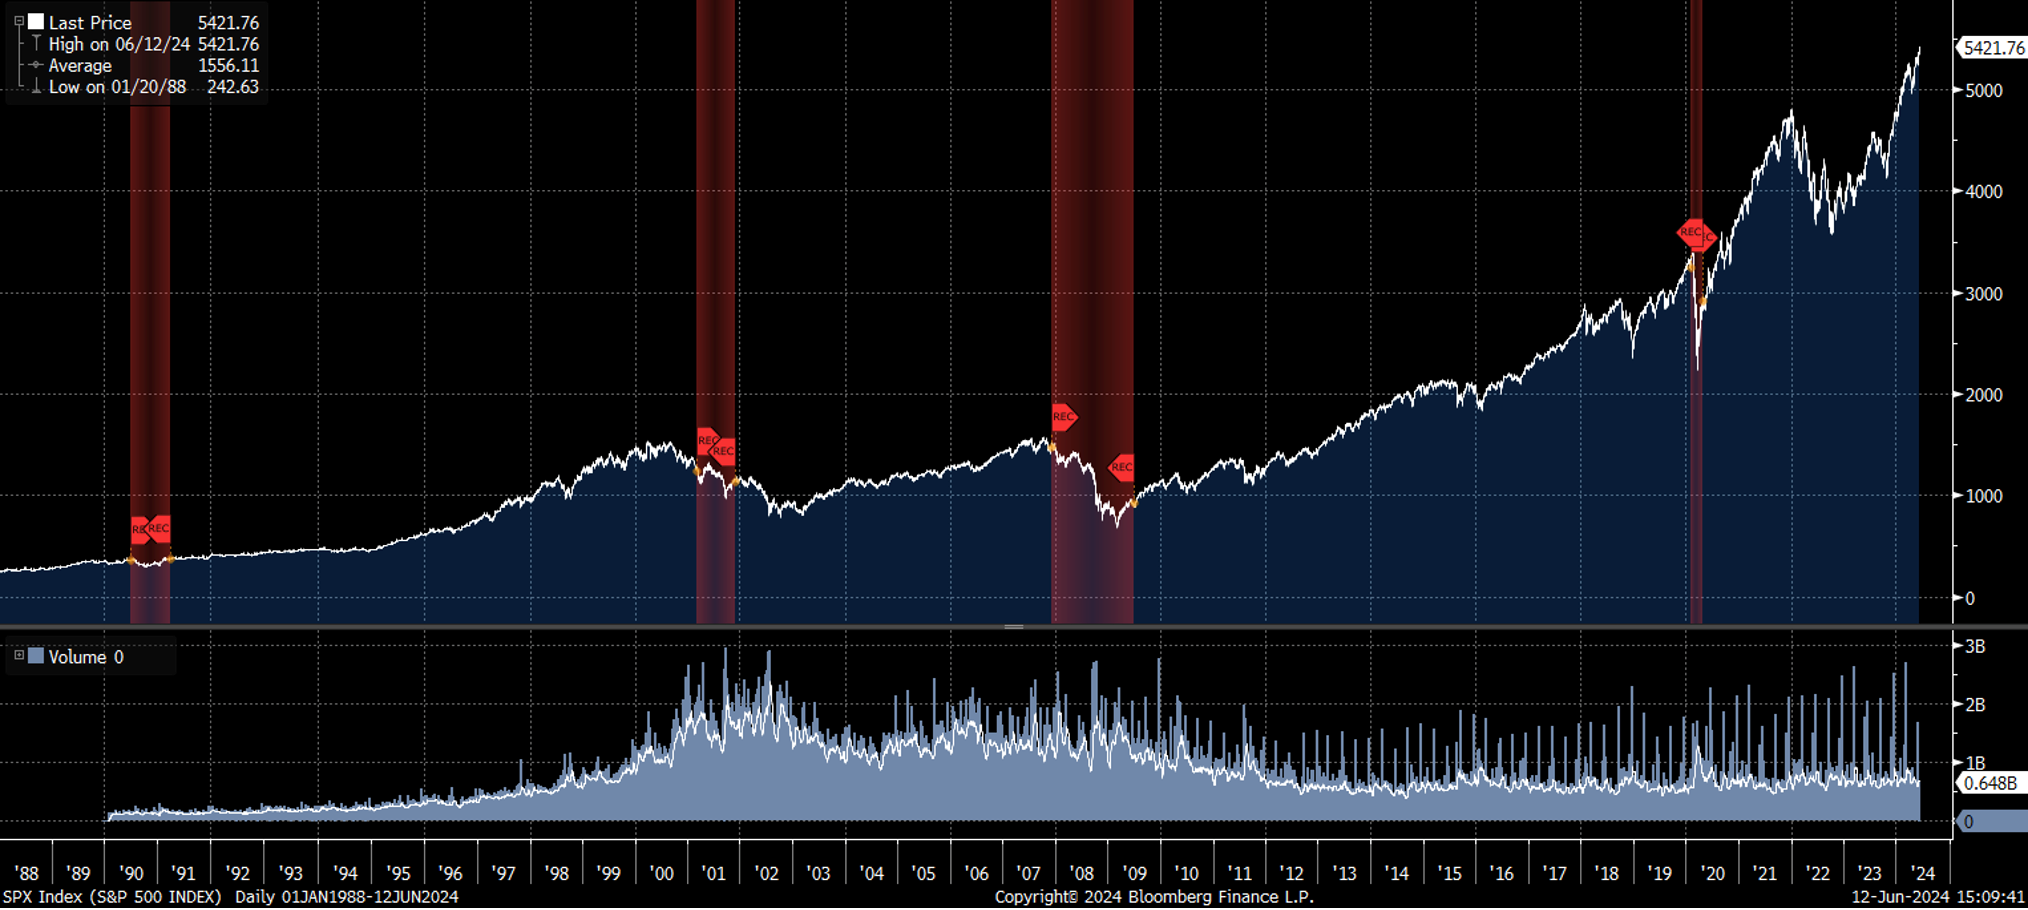
Overall, financial markets appear to view President Trump’s re-election and his economic agenda favorably. Since the close of trading on Monday, November 4 through Tuesday, December 9, the S&P 500 is up +6.0%, Nasdaq +8.6%, and Russell 2000 +7.8%. This business-friendly momentum was only underscored by President Trump’s announcement this week that his Administration will fast track environmental approvals and other permits for any companies investing $1 billion or more in the United States.

Reflecting the investor exuberance today, major equity indices are hitting all-time highs, and credit spreads are historically tight. For example, the extra premium that investors are currently demanding to own Baa-rated corporate bonds over Aaa-rateds is only 61 basis point, according to Bloomberg. Previous times that we’ve seen such a low risk premium (“tight” credit spread) were: early 2005, summer 2014, 2017, and late 2021/early 2022. 

At the same time, equity valuations are historically expensive. According to Bloomberg, the S&P 500 has recently traded at a price-to-earnings ratio of more than 25x, compared to a post-1991 average around 20x. In terms of its enterprise value to EBITDA ratio, the S&P has recently traded near 16x, compared to a post-1991 average around 11x.

Indeed, the business outlook looks rosy. Major tax and regulatory relief are on the horizon; the Fed is on a rate-cutting path; artificial intelligence has sparked a tech boom and could be transformational for the economy at large; and by virtue of their aggressive actions in Spring 2023, the Fed has a strong, recent track record of supporting the banking system as some financials navigate the inflation and interest rate surprises of recent years.

But when looking at today’s equity and credit markets through the valuation prism, there’s arguably not a lot of risk being discounted by financial markets today. While it seems counter-intuitive, the rosy outlook has heightened valuations to such a degree that the risk-reward profile is arguably unfavorable for risk assets.

Of course, the business-friendly outlook could be validated in coming months, existing risks might not worsen or new risks might not emerge, and the risk-on environment could therefore continue. So now, with the election uncertainty behind us, the biggest question facing investors might be whether this favorable outlook is sustainable. Given the relatively high equity valuations and tight credit spreads, it seems a lot of things will need to go right next year for investors to once again generate outsized returns. 

Paul Hoffmeister is Chief Economist and Portfolio Manager at Camelot Portfolios, managing partner of Camelot Event-Driven Advisors (CEDA), and co-portfolio manager of the Camelot Event-Driven Fund (EVDIX • EVDAX).

Camelot Event-Driven Advisors LLC | 1700 Woodlands Drive | Maumee, OH 43537 // B616  

Disclosures:
•       Past performance may not be indicative of future results. Therefore, no current or prospective client should assume that the future performance of any specific investment, investment strategy (including the investments and/or investment strategies recommended by the adviser), will be profitable or equal to past performance levels.
•       This material is intended to be educational in nature, and not as a recommendation of any particular strategy, approach, product or concept for any particular advisor or client.  These materials are not intended as any form of substitute for individualized investment advice.  The discussion is general in nature, and therefore not intended to recommend or endorse any asset class, security, or technical aspect of any security for the purpose of allowing a reader to use the approach on their own.  Before participating in any investment program or making any investment, clients as well as all other readers are encouraged to consult with their own professional advisers, including investment advisers and tax advisors.  Camelot Event Driven Advisors can assist in determining a suitable investment approach for a given individual, which may or may not closely resemble the strategies outlined herein.
•       Any charts, graphs, or visual aids presented herein are intended to demonstrate concepts more fully discussed in the text of this brochure, and which cannot be fully explained without the assistance of a professional from Camelot Portfolios LLC.  Readers should not in any way interpret these visual aids as a device with which to ascertain investment decisions or an investment approach.  Only your professional adviser should interpret this information.
•       Some information in this presentation is gleaned from third party sources, and while believed to be reliable, is not independently verified.
•       Camelot Event-Driven Advisors, LLC, is registered as an investment adviser with the United States Securities and Exchange Commission. Registration as an investment adviser does not imply any certain degree of skill or training. Camelot Event-Driven Advisors, LLC’s disclosure document, ADV Firm Brochure is available at http://adviserinfo.sec.gov/firm/summary/291798


Copyright © 2024 Camelot Event-Driven Advisors, All rights reserved.

You Are Here: An Economic, Market & Political Lay of the Land

by Paul Hoffmeister, Portfolio Manager and Chief Economist

At the link below, you’ll find a compelling market commentary presentation from our September Advisor Series event. 

Discussion includes:
     • major macroeconomic indicators suggesting a recession is likely
     • reasons why those signals seem to have been incorrect so far
     • the major risks and uncertainties looming today

In sum, it appears that the confluence of historic government spending, the eruption of new AI technologies since early 2023, the Fed intervention in Spring 2023, and a strong labor market worked to prevent a recession up to this point. But recession threats persist.

The U.S. manufacturing and service sectors are relatively weak, and the labor market appears to be cracking. Since 1970, when the unemployment rate cycles higher, it tends to have a negative momentum to it and can continue for a prolonged period of time. As a result, weakening economic data and employment conditions are threatening equity markets, which themselves carry high valuations.

Will the commencement of a new Fed rate-cutting cycle stave off recession? It’s certainly possible. But, as we show with the last three rate-cutting cycles (2001, 2007, 2019), recent history isn’t on the Fed’s side.

Paul Hoffmeister is Chief Economist and Portfolio Manager at Camelot Portfolios, managing partner of Camelot Event-Driven Advisors (CEDA), and co-portfolio manager of the Camelot Event-Driven Fund (EVDIX • EVDAX).

Camelot Event-Driven Advisors LLC | 1700 Woodlands Drive | Maumee, OH 43537 // C146  

Disclosures:
•       Past performance may not be indicative of future results. Therefore, no current or prospective client should assume that the future performance of any specific investment, investment strategy (including the investments and/or investment strategies recommended by the adviser), will be profitable or equal to past performance levels.
•       This material is intended to be educational in nature, and not as a recommendation of any particular strategy, approach, product or concept for any particular advisor or client.  These materials are not intended as any form of substitute for individualized investment advice.  The discussion is general in nature, and therefore not intended to recommend or endorse any asset class, security, or technical aspect of any security for the purpose of allowing a reader to use the approach on their own.  Before participating in any investment program or making any investment, clients as well as all other readers are encouraged to consult with their own professional advisers, including investment advisers and tax advisors.  Camelot Event Driven Advisors can assist in determining a suitable investment approach for a given individual, which may or may not closely resemble the strategies outlined herein.
•       Any charts, graphs, or visual aids presented herein are intended to demonstrate concepts more fully discussed in the text of this brochure, and which cannot be fully explained without the assistance of a professional from Camelot Portfolios LLC.  Readers should not in any way interpret these visual aids as a device with which to ascertain investment decisions or an investment approach.  Only your professional adviser should interpret this information.
•       Some information in this presentation is gleaned from third party sources, and while believed to be reliable, is not independently verified.
•       Camelot Event-Driven Advisors, LLC, is registered as an investment adviser with the United States Securities and Exchange Commission. Registration as an investment adviser does not imply any certain degree of skill or training. Camelot Event-Driven Advisors, LLC’s disclosure document, ADV Firm Brochure is available at http://adviserinfo.sec.gov/firm/summary/291798


Copyright © 2024 Camelot Event-Driven Advisors, All rights reserved.

Sahm Rule Triggered – Equities Vulnerable

by Paul Hoffmeister, Portfolio Manager and Chief Economist

  • The “Sahm Rule” has been triggered, suggesting that the US economy might already be in recession.

  • Upcycles in unemployment can have significant momentum. During previous episodes since 1970 when the Rule was triggered, the unemployment rate has increased by a median of 1.6 percentage points twelve months later. This implies that today’s unemployment rate of 4.3% may increase to 5.9% by next summer.

  • Upturns in unemployment like we’re seeing today have historically correlated with recession and weak equity markets.

It’s possible that the US economy is now in recession, at least according to the “Sahm Rule”, an obscure economic signal. 

The Sahm Recession Indicator, named after former Federal Reserve economist and current Chief Economist at New Century Advisors Claudia Sahm, “signals the start of a recession when the three-month moving average of the national unemployment rate rises by 0.50 percentage points or more relative to the minimum of the three-month averages from the previous 12 months." (St. Louis Federal Reserve Bank)

In terms of the headline numbers, the unemployment rate jumped more than expected in July to 4.3%, which is a significant increase from 3.7% at the beginning of the year and from 3.5% in July 2023. (Bureau of Labor Statistics) From the perspective of the Sahm Recession Indicator, the current three-month moving average has increased by 0.53 relative to the low in that moving average during the last year; and as a result, the Indicator suggests that a recession in the United States has likely already begun. 

We won’t know for a while if the economy is officially in recession today. It takes many months for the National Bureau of Economic Research (NBER) to officially declare any recession start dates. And, of course, there’s no guarantee that the Sahm Rule is correct right now. Even Claudia Sahm herself has recently cautioned: past performance is no guarantee of future results. 

In fact, she isn’t convinced that the Rule is correct this time, although the jump in unemployment is “disconcerting.” As she sees it, the increase in the unemployment rate may be more due to an increase in labor supply rather than weakening labor demand, and if so, it’s possible that the US economy is not yet in recession.

Notwithstanding, the Sahm Rule has a good track record that must be considered. Every time that it has been triggered since 1970, it has been correct in signaling the beginning of recession. 

If anything, the recent triggering of the Sahm Rule is a warning to policymakers at the Federal Reserve. As investors, our biggest concern is the momentum that a rising unemployment rate can have. Quite simply, during economic downturns, unemployment tends to rise for a while.

After analyzing the Sahm Rule and the unemployment data since 1970 (and excluding the unique Covid pandemic experience), we have found that once the Sahm Rule is triggered (i.e. its level exceeds 0.50 for the first time in an economic cycle), the unemployment rate increases twelve months later by a median of 1.6%. This would mean that the current unemployment rate will possibly increase to 5.9% by next summer. 

Chart of the 3-month/10-year Treasury spread (dotted white line), core PCE year-over-year inflation (orange line), and the U.S. unemployment rate (white line); recession periods highlighted in red. Source: Bloomberg.

This outlook is quite different from the Fed’s forecasts. In their June projections, the median expectation among Federal Reserve Board members and Federal Reserve Bank Presidents was that the unemployment rate would be only 4.2% by year-end 2025. 

The historical record of rising unemployment after triggering the Sahm Rule is just another reason why we believe that the Fed is currently behind the curve. But even more, we’re concerned that worsening employment will lead to weaker equity markets. In the past, an environment of persistently rising unemployment tends to correlate with a slowing economy, slowing earnings growth, and generally falling stock prices. Indeed, as the chart above illustrates, during the last 35 years, each upcycle in unemployment was associated with both recession and weak stock indices.

In sum, we view the recent triggering of the Sahm Rule and the recent jump in the unemployment rate as additional data points -- alongside the inverted yield curve, weak leading economic indicators and many other indicators -- that an economic recession is on the horizon, if not already here. Based on the historical evidence, we expect this year’s increase in unemployment to continue and in so doing will lead to further economic and equity market weakness.

Paul Hoffmeister is Chief Economist and Portfolio Manager at Camelot Portfolios, managing partner of Camelot Event-Driven Advisors (CEDA), and co-portfolio manager of the Camelot Event-Driven Fund (EVDIX • EVDAX).

Camelot Event-Driven Advisors LLC | 1700 Woodlands Drive | Maumee, OH 43537 // B593

Disclosures:
•       Past performance may not be indicative of future results. Therefore, no current or prospective client should assume that the future performance of any specific investment, investment strategy (including the investments and/or investment strategies recommended by the adviser), will be profitable or equal to past performance levels.
•       This material is intended to be educational in nature, and not as a recommendation of any particular strategy, approach, product or concept for any particular advisor or client.  These materials are not intended as any form of substitute for individualized investment advice.  The discussion is general in nature, and therefore not intended to recommend or endorse any asset class, security, or technical aspect of any security for the purpose of allowing a reader to use the approach on their own.  Before participating in any investment program or making any investment, clients as well as all other readers are encouraged to consult with their own professional advisers, including investment advisers and tax advisors.  Camelot Event Driven Advisors can assist in determining a suitable investment approach for a given individual, which may or may not closely resemble the strategies outlined herein.
•       Any charts, graphs, or visual aids presented herein are intended to demonstrate concepts more fully discussed in the text of this brochure, and which cannot be fully explained without the assistance of a professional from Camelot Portfolios LLC.  Readers should not in any way interpret these visual aids as a device with which to ascertain investment decisions or an investment approach.  Only your professional adviser should interpret this information.
•       Some information in this presentation is gleaned from third party sources, and while believed to be reliable, is not independently verified.
•       Camelot Event-Driven Advisors, LLC, is registered as an investment adviser with the United States Securities and Exchange Commission. Registration as an investment adviser does not imply any certain degree of skill or training. Camelot Event-Driven Advisors, LLC’s disclosure document, ADV Firm Brochure is available at http://adviserinfo.sec.gov/firm/summary/291798


Copyright © 2024 Camelot Event-Driven Advisors, All rights reserved.

Yield Curve Wants Rate Cuts

by Paul Hoffmeister, Portfolio Manager and Chief Economist

With recent economic reports showing inflation falling and unemployment rising, the Federal Reserve appears to be on the verge of cutting interest rates before the end of the year. 

Specifically, the core PCE inflation gauge shows that as of May, year-over-year inflation rose 2.6%. Inflation pressures had been steadily declining since reaching a high of 5.5% in 2022, but stalled briefly around 2.8% early this year. Now, confidence has grown that inflation’s decline has reasserted itself and is trending toward the Fed’s long-term goal of 2%. (Bureau of Economic Analysis)

At the same time, the unemployment rate stood at 4.1% in June. After bottoming at 3.4% in early 2023, the Fed’s interest rate increases of the last two years are weighing on the economy. (Bureau of Labor Statistics)

Within the context of this recent data, Fed Chairman Powell told Congress last week that the United States is “no longer an overheated economy” and the “labor market appears to be fully back in balance”. (“US economy no longer overheated, Fed’s Powell tells Congress”, by Howard Schneider and Ann Saphir, Reuters, July 9, 2024.) As a result, the fed funds futures market expects that, by year-end, the Fed will cut the funds rate by 50 basis points from its current 5.25%-5.5% to 4.75%-5.0%.

While we believe the dovish shift at the Fed is welcome news and important for markets and the economy, the recent upturn in the unemployment rate is particularly concerning because it suggests a high probability of a looming recession. 

According to the “Sahm Rule”, developed by former Fed economist Claudia Sahm, when the unemployment rate rises at least half a percentage point (0.50%) above its low point in the past year, a recession has begun. What does this rule look like today? After the recent employment data, the Sahm Rule rose to 0.43%; very close to the 0.50% threshold.

Chart of Core PCE year-over-year inflation (orange line) versus the U.S. unemployment rate (white line); recession periods highlighted in red. Source: Bloomberg.

Simply looking at the last 25 years, the recent increase in unemployment looks similar to the months before the 2001 and 2008-2009 recessions. Today, there are almost 800,000 more people unemployed compared to a year ago, and with short-term interest rates currently in restrictive territory AS WELL AS the likelihood that the lagged effects of the last two years of tight monetary policy will weigh further on the economy, there appears to be an increasingly negative momentum in the economy. 

Some important questions today are how much momentum is there to the current economic slowdown? And, will the expected interest rate cuts quickly abate that momentum?

Chart of the 3-month/10-year Treasury spread (dotted white line), core PCE year-over-year inflation (orange line), and the U.S. unemployment rate (white line); recession periods highlighted in red. Source: Bloomberg.

Historically, the yield curve, especially the 3-month/10-year Treasury spread, has been a relatively useful leading indicator of economic activity. Today, it stands around -116 basis points. In our view, the story it currently tells is that an economic contraction is on the near-term horizon, and the Fed is arguably “too tight” -- by at least 100-125 basis points. 

Unfortunately, it’s generally expected that the funds rate will only be reduced by about 50 basis points by year-end. And according to the FOMC’s economic projections published last month, the median expectation among policymakers is that the funds rate will fall to 3.9%-4.4% by year-end 2025, which is a year and a half away.

Putting all the clues and evidence together, it’s welcome news that the Fed appears to be on the verge of cutting interest rates in the coming months because the economy appears to be slowing. And as we see it, the forward-looking yield curve seems to suggest that today’s negative economic momentum will be significant enough to push the economy into contraction (recession); so the rate cuts couldn’t come fast enough.    

Paul Hoffmeister is Chief Economist and Portfolio Manager at Camelot Portfolios, managing partner of Camelot Event-Driven Advisors (CEDA), and co-portfolio manager of the Camelot Event-Driven Fund (EVDIX • EVDAX).

Camelot Event-Driven Advisors LLC | 1700 Woodlands Drive | Maumee, OH 43537 // B575  

Disclosures:
•       Past performance may not be indicative of future results. Therefore, no current or prospective client should assume that the future performance of any specific investment, investment strategy (including the investments and/or investment strategies recommended by the adviser), will be profitable or equal to past performance levels.
•       This material is intended to be educational in nature, and not as a recommendation of any particular strategy, approach, product or concept for any particular advisor or client.  These materials are not intended as any form of substitute for individualized investment advice.  The discussion is general in nature, and therefore not intended to recommend or endorse any asset class, security, or technical aspect of any security for the purpose of allowing a reader to use the approach on their own.  Before participating in any investment program or making any investment, clients as well as all other readers are encouraged to consult with their own professional advisers, including investment advisers and tax advisors.  Camelot Event Driven Advisors can assist in determining a suitable investment approach for a given individual, which may or may not closely resemble the strategies outlined herein.
•       Any charts, graphs, or visual aids presented herein are intended to demonstrate concepts more fully discussed in the text of this brochure, and which cannot be fully explained without the assistance of a professional from Camelot Portfolios LLC.  Readers should not in any way interpret these visual aids as a device with which to ascertain investment decisions or an investment approach.  Only your professional adviser should interpret this information.
•       Some information in this presentation is gleaned from third party sources, and while believed to be reliable, is not independently verified.
•       Camelot Event-Driven Advisors, LLC, is registered as an investment adviser with the United States Securities and Exchange Commission. Registration as an investment adviser does not imply any certain degree of skill or training. Camelot Event-Driven Advisors, LLC’s disclosure document, ADV Firm Brochure is available at http://adviserinfo.sec.gov/firm/summary/291798


Copyright © 2024 Camelot Event-Driven Advisors, All rights reserved.

Unemployment, Recessions, and the S&P 500

by Paul Hoffmeister, Portfolios Manager and Chief Economist

Last month, we explained that interest rates were expected to stay higher for longer because inflation had become stubborn. Core PCE was holding near 2.8% in recent months, after declining nicely from 5.5% since 2022. As a result, the market had come to expect only one or two quarter point rate cuts by year-end, compared to as many as four or five at the beginning of this year. 

We also added that the Fed’s reaction function for deciding whether and to what degree to cut rates later this year will likely be predicated on the core PCE falling convincingly toward 2% and/or the unemployment rate jumping meaningfully higher than 4%. 

Last Friday, the unemployment rate increased to 4%; a level not seen since Q1 2022. From an economic and market perspective, the level may not be as important as the rate of change. A year ago during Q2 2023, the unemployment rate hovered around 3.6%. The reason that’s important is because, based on the Sahm Rule, it’s likely that the US economy will be entering recession if the rate soon reaches 4.1-4.2%. (According to the St. Louis Federal Reserve, the Sahm Rule “signals the start of a recession when the three-month moving average of the national unemployment rate rises by 0.50 percentage points or more relative to the minimum of the three-month averages from the previous 12 months.")

While there has recently been some contradictory labor market data indicating that employment is actually increasing, we believe that the rising unemployment rate is closer to the truth and that the labor market and economy are weakening at the margins. In our view, this would be much more consistent with a slew of macroeconomic indicators and signals showing deterioration; such as the inverted yield curve, relatively weak leading economic indicators, cautious lending surveys, weak regional Fed data, and qualitative feedback published in the Fed Beige Book from economic participants across the country.

U.S. Unemployment Rate (recessions highlighted in red). Source: Bloomberg.

The chart above illustrates the unemployment rate since 1988 and periods of recession (highlighted in red columns). Indeed, upturns in the rate like we’re seeing today, strongly suggest an economic contraction on the horizon. 

Notwithstanding, why does the question of recession matter to investors? After all, some US stock market indices (and other foreign indices) have recently hit all-time highs, certain credit spreads are relatively tight, and credit market conditions are seemingly excellent. 

It’s relevant because economic contraction tends to correlate with not only slower earnings growth but also significant downside risk in equity indices. For example, within the context of the 2001 recession, quarterly earnings in the S&P 500 fell from $14.68 in Q3 2000 to $10.43 in Q1 2002. (Bloomberg) Within the context of the 2007-2009 recession, quarterly earnings fell from $24.55 in Q3 2007 to as low as $5.87 in Q1 2009. (Bloomberg) Based on the historical evidence, economic contractions can meaningfully impact the S&P 500. 

Naturally, if earnings decline, stock valuations and stock prices are threatened. Between Q3 2000 and Q1 2002, the S&P 500 lost nearly 28%. Between Q3 2007 and Q1 2009, it lost almost 56%.

S&P 500 Index (recessions highlighted in red). Source: Bloomberg.

A lot of attention is being paid on Fed policy, inflation and employment data. Of course, a 2024-2025 recession isn’t pre-determined. But the history of the last few decades suggests that a slowly deteriorating labor market, which is what we might be seeing now, raises the specter of recession and weaker equity markets.

Click Below to Register for:

CEDA’s Monthly Event-Driven Call!

2nd Tuesday each month. 2pm with 2PMs. 22 Minutes.

Paul Hoffmeister is Chief Economist and Portfolio Manager at Camelot Portfolios, managing partner of Camelot Event-Driven Advisors (CEDA), and co-portfolio manager of the Camelot Event-Driven Fund (EVDIX • EVDAX).

Camelot Event-Driven Advisors LLC | 1700 Woodlands Drive | Maumee, OH 43537 // B573 
 
Disclosures:
•       Past performance may not be indicative of future results. Therefore, no current or prospective client should assume that the future performance of any specific investment, investment strategy (including the investments and/or investment strategies recommended by the adviser), will be profitable or equal to past performance levels.
•       This material is intended to be educational in nature, and not as a recommendation of any particular strategy, approach, product or concept for any particular advisor or client.  These materials are not intended as any form of substitute for individualized investment advice.  The discussion is general in nature, and therefore not intended to recommend or endorse any asset class, security, or technical aspect of any security for the purpose of allowing a reader to use the approach on their own.  Before participating in any investment program or making any investment, clients as well as all other readers are encouraged to consult with their own professional advisers, including investment advisers and tax advisors.  Camelot Event Driven Advisors can assist in determining a suitable investment approach for a given individual, which may or may not closely resemble the strategies outlined herein.
•       Any charts, graphs, or visual aids presented herein are intended to demonstrate concepts more fully discussed in the text of this brochure, and which cannot be fully explained without the assistance of a professional from Camelot Portfolios LLC.  Readers should not in any way interpret these visual aids as a device with which to ascertain investment decisions or an investment approach.  Only your professional adviser should interpret this information.
•       Some information in this presentation is gleaned from third party sources, and while believed to be reliable, is not independently verified.
•       Camelot Event-Driven Advisors, LLC, is registered as an investment adviser with the United States Securities and Exchange Commission. Registration as an investment adviser does not imply any certain degree of skill or training. Camelot Event-Driven Advisors, LLC’s disclosure document, ADV Firm Brochure is available at http://adviserinfo.sec.gov/firm/summary/291798

Copyright © 2024 Camelot Event-Driven Advisors, All rights reserved.