

The primary macrovariables driving equities in 2018 appeared to be the Fed and US-China trade. Positive news in both during 2019 are likely to spark a strong rally.
December Market Commentary
Market of Extremes in 2019
By Paul Hoffmeister, Chief Economist
· We believe the equity market in 2019 will be one of extremes – where indices will be either significantly higher or lower. Less likely will be a market of middling or average returns.
· Major macro variables -- including Fed policy, the political outlook and US-China trade – remain highly ambiguous, despite some market-friendly news in each during the last month.
· These uncertainties should either resolve themselves positively and cracks in the global economy will heal (allowing for a strong market rally), or uncertainties and economic fundamentals will deteriorate significantly (and drag markets meaningfully lower).
· In our judgment, we are more likely to see in 2019 more market-positive news than negative, even though it is difficult to see the economy improving markedly from current levels.
In last month’s letter, we suggested that with the midterms completed and impeachment prospects seemingly diminished, the primary market drivers would become the Fed outlook and US-China trade negotiations. Indeed, during the last month major news emerged from both variables and moved markets in a big way.
On Wednesday, November 28, Federal Reserve Chairman Powell said that interest rates appeared to be “just below” neutral, suggesting that slightly more dovish Fed policy was likely next year.[1] That day, the comment contributed to a 2.3% rally in the S&P 500.[2]
Then on December 2, it appeared that President Trump had reached a temporary truce with China’s President Xi. Following their dinner at the G20 Summit, Trump announced that he would hold off on raising tariffs on Chinese goods to 25%.[3] In exchange, China reportedly promised to increase its purchases of US farm, energy and industrial products, and start new talks on Chinese policies related to forced technology transfers, intellectual property, cyber theft, and other perceived regulatory abuses against foreign companies.[4]
One could assume that if the White House didn’t see a significant shift in views by Chinese officials toward the US position, then this temporary agreement would not have been reached. The White House has stated, however, that if a larger agreement isn’t reached within 90 days (from December 1), then President Trump may apply the 25% tariff.[5] In trading on Monday December 3, the S&P 500 rallied 1.1%.[6]
To put last month’s trading into context, the S&P 500 rallied 2.1% the day after Election Day, 2.3% the day of Powell’s testimony, and 1.1% on the Monday following the Trump-Xi truce. These three major rallies speak to how much these macro variables have been weighing on financial markets.
So, do equity markets have the “all clear” sign?
We believe not yet, and ultimately the market in 2019 will be one of extremes – where indices will be either significantly higher or lower. Less likely will be a market of middling or average returns.
While it’s arguably positive that we’ve apparently seen (a) more political certainty following the elections, (b) a Fed that’s “listening” to market signals, and (c) positive headway in US-China negotiations, none of these variables have been completely eliminated. Major uncertainties persist and underlying cracks in the global economy are beginning to appear. China, Japan, and India are showing notable signs of weakness; and in the United States, slowing home sales and declining oil prices could portend weakening demand.[7]
In our view, these uncertainties will either resolve themselves positively and the cracks will heal (allowing for a strong market rally), or the uncertainties and economic fundamentals will deteriorate significantly (and drag markets meaningfully lower).
Some important questions for 2019 are: Will the Mueller investigation lead to the President’s impeachment and removal from office? Will the Fed simply announce an end to its rate-hiking campaign? And will China concede to the United States on some of the most intractable trade issues?
The Special Counsel investigation is a major wild card that could produce sudden, far-reaching outcomes. In a recent column for USA Today, Peter Zeidenberg, a former special prosecutor and deputy special counsel in the prosecution of Scooter Libby, suggested that the Mueller investigation appears to be reaching its endgame, and it will make the case that a conspiracy occurred to interfere with the 2016 elections “that will likely ensnare the president’s family and, quite likely, Trump himself.” [8] While Speaker Pelosi seemingly played down last month the prospect of impeachment, Democrats will very likely use their Constitutional power of executive oversight if conditions on the ground change.
As for the Fed outlook, we view Chairman Powell’s conciliatory remarks that the current funds rate is “just below” neutral as reaffirmation that forthcoming rate increases will be highly data dependent, rather than off the table. As a result, financial markets will most likely be constrained during the coming year due to concerns that good news (economically) could be used as justification for additional rate increases to temper such activity. This should also have a depressive effect on the economy. How can businesses confidently deploy risk-taking capital as the Fed seems to continuously consider “restrictive” interest rate policy?
A vague Fed policy outlook in the forthcoming year is especially probable given that some Fed officials subscribe to the Philips Curve Theory that low unemployment can spark inflation. With the official unemployment rate at 3.8% and the so-called natural rate of unemployment (known as “NAIRU”) at 4.6%, it’s hard to imagine that these FOMC members will stand by quietly while their models suggest that the historic shrinkage in excess labor threatens to cause wage-push inflation.[9] Consequently, we expect the Fed to threaten financial markets next year, at least in spirit and/or jawboning, should there be too much of an economic good thing.
A major question regarding US-China trade negotiations remains, as we outlined last month: the degree to which both sides will concede on the most sensitive trade disagreements. The 2017 US National Security Strategy Assessment concluded that China pursues six strategies of “economic aggression” with 50 acts, policies, and practices to achieve those aims.[10] Even if China acquiesced on twenty-five of those major tactics, will that be enough for President Trump? After all, any unresolved tactics will continue to be a serious thorn in the trade relationship.
Pessimists could argue that President Xi does not face as much pressure as President Trump, which could delay any meaningful resolution. Mr. Trump’s re-election is quickly approaching, and US equity market performance, a barometer that seems to be closely watched by the White House, is waning. Maybe Xi will accept short-term economic pain in China and wait for Trump to bend, or otherwise gamble to deal with a different US President in 2021?
As one might reasonably see, these three variables could easily devolve and threaten equity markets in 2019. Conversely, they could be resolved; and given the great uncertainty that exists in these variables today, it could catalyze a major relief rally.
The Mueller investigation could ultimately avoid implicating the President, forestalling an impeachment push; the Fed might “thread the needle”; and the US and China could reach at least a partial deal that’s married with a framework for future negotiations on a range of outstanding areas of disagreement.
Perhaps, amidst all the ambiguities facing the market today about a range of fundamentally important issues, the biggest question for 2019 is, which market extreme will we see?
In our judgment, we are more likely to see in 2019 more market-positive news than negative, even though it is difficult to see the economy improving markedly from current levels.
Predicting the political implications of the Mueller investigation is seemingly impossible. But, the market’s (not to mention the White House’s) protestations against the current Fed policy trajectory seem too loud and obvious to ignore. We expect Fed pronouncements to increasingly acknowledge global economic risks and the FOMC to not raise the funds rate more than a quarter point next year.
Furthermore, the pressure on Presidents Trump and Xi to reach an agreement to reduce trade tensions is, in our view, equally great. Mr. Trump is facing re-election and will be unable to easily employ other market-friendly levers to appease financial markets. As such, he appears more likely to find areas of compromise.
As for Mr. Xi, prosperity is vital for political stability in a one party system. And arguably, China has “caught up” enough, economically, with the rest of the world -- thanks in part to its protectionist trade policies. Even more, it’s unlikely that Mr. Xi would be willing to gamble on waiting for another U.S. President with whom to negotiate. Were it a Democratic-controlled White House in 2021, it’s very possible that the drive for restructuring the US-China trade relationship will be even stronger. After all, Speaker Pelosi has been a vocal critic of the relationship for a long time. For example, she unequivocally stated last year: “For years now, China’s brazenly unfair trade practices have weakened America’s economy and hurt American workers.”[11] Xi has been described by Donald Trump as a “world class poker player”; we believe he’s more likely than ever to cash in a lot of his chips while he’s ahead, rather than face even bigger risks in the coming year.[12]

Paul Hoffmeister is chief economist and portfolio manager at Camelot Portfolios, managing partner of Camelot Event-Driven Advisors, and co-portfolio manager of Camelot Event-Driven Fund (tickers: EVDIX, EVDAX).
[1] “Did Fed’s Powell ‘Light the Fuse’ For a Year-End Stock-Market Rally?” by William Watts, November 29, 2018, MarketWatch.
[2] Ibid.
[3] “Trump’s China Trade Truce”, WSJ Editorial Board, December 2, 2018, Wall Street Journal.
[4] Ibid.
[5] “White House Corrects Top Aide on China Negotiations Timeline”, by Caroline Kelly and Kaitlan Collins, December 3, 2018, CNN.
[6] “Stocks Close Higher as S&P 500 Has Best Start to December since 2010 on Trade-War Truce”, by Sue Chang, December 3, 2018, MarketWatch.
[7] “Asia’s Weakening Economies, Record Supply Threaten to Create Oil Glut”, by Henning Gloystein, November 13, 2018, Reuters.
[8] “Mueller Is Building a Conspiracy Case That’s Likely to Ensnare Trump and His Family”, by Peter Zeidenberg, December 3, 2018, USAToday.
[9] Data source: Federal Reserve Bank of St. Louis.
[10] Full Transcript: White House National Trade Council Director Peter Navarro on Chinese Economic Aggression,” July 9, 2018, Hudson Institute.
[11] “Pelosi Statement on China Trade Investigation Memo”, Press Release, August 14, 2017, Office of Speaker-Designate Pelosi.
[12] “Trump: Xi Is a World Class Poker Player”, May 22, 2018, BBC News.
Midterms Over, Shifting Focus onto Fed and China
By Paul Hoffmeister, Chief Economist
November 2018
One could say that the midterm elections were a split decision, and neither a “blue wave” nor “red wave” occurred. By early indications, Democrats appeared to gain at least 26 seats (they needed 23) to regain the majority in the House, while Republicans expanded their Senate majority from 51 to 54 seats. [1] [2]
Perhaps the most important development following the election results was the tone from the leadership of both Parties. On Wednesday, President Trump congratulated Speaker Pelosi and expressed a desire to work together during the next two years. He said:
“Hopefully, we can all work together next year to continue delivering for the American people, including on economic growth, infrastructure, trade, lowering the cost of prescription drugs. These are some of things that the Democrats do want to work on, and I really believe we’ll be able to do that. I think we’re going to have a lot of reason to do it.”[3]
Nancy Pelosi sounded a similar message:
“We will strive for bipartisanship. We believe we have a responsibility to seek common ground where we can. Where we cannot, we must stand our ground. But we must try. So openness and transparency, accountability, bipartisanship, are a very important part of how we will go forward.”[4]
When asked about impeachment Tuesday evening, Pelosi told CNBC, “I don’t think there’s any impeachment unless it’s bipartisan. Our priority is to get results for the American people.”[5] And later, in an interview with PBS, Pelosi said, “For those who want impeachment, that’s not what our caucus is about.”[6]
Very quickly, concerns about a potential impeachment seemed to have been put to rest. Arguably, this is important for financial markets, which could have faced serious headwinds if they were mired in months of political uncertainty. As we explained in September, we believe the Clinton-Lewinsky scandal and impeachment prospects in 1998 were a significant factor behind a nearly 15% sell off in the S&P 500.
There also seems to be, at least for now, a real desire by both President Trump and Speaker Pelosi to legislate on issues where they can – perhaps infrastructure, prescription drug prices, and trade issues. Mr. Trump even acknowledged that he was willing to make a deal on middle-class tax cuts if Democrats proposed an idea.
With impeachment prospects seemingly eliminated and the possibility of dealmaking in Washington (within certain parameters, of course), it makes sense to us that equity markets were relieved and even optimistic last Wednesday, with the S&P 500 rallying almost 2.1%.[7]
So, what now for markets?
We believe some of the most important variables that will drive markets in the coming months will be the Fed outlook and US-China trade.
Art Laffer once said: “If regulatory policy is important by a factor of 1, then fiscal policy is important by a factor of 10, and monetary policy is important by a factor of 100.” In that vein, we believe Fed policy was a key factor behind much of the market volatility this year, and will be a critical factor behind market performance next year.
With some Fed members concerned about the so-called Philips Curve (the theory that low unemployment can spark inflation), how will the Federal Open Market Committee respond today’s historically low unemployment rate? Will it go so far as to invert the yield curve next year? If so, we expect even more criticism from the White House and classical economists. As Larry Kudlow told CNBC’s Scott Wapner last month, “…low unemployment is a good thing. Rising wages is a good thing. More people working and prospering is a good thing.”[8]
US-China relations are another major issue. The relationship seems to be changing massively, and China appears to be increasingly viewed in Washington as an economic rival and even adversary.
The New York Times reported in October that if a trade deal isn’t reached soon, the Trump trade strategy will be to reach trade deals with other countries and isolate China.[9] For example, if the United States reaches bilateral trade deals with Korea, Japan, Canada, Mexico, and the EU, this sphere of trade could comprise the majority of global commerce; and leave China on the outside.
Gary Cohn, President Trump’s former National Economic Council Director, isn’t too optimistic about a deal being reached soon. The day after the elections, he told Bloomberg’s David Rubenstein:
“I don’t think there’s a instant cure for the trade issue. I really don’t. I wish that I could sit here and say after the midterm elections, the White House, the Administration understand they’ve got to solve the trade issues. I think China would like to solve the trade issue. It really comes down to two... I would say there’s two main topics. Topic number one, for some reason, is the size of the trade deficit. The actual trade deficit with China is about $300 billion, net. And the President seems to think that number is way too large. I tend to differ with that. I tend to say that’s $300 billion worth of goods that we’re buying cheaper than we could produce ourselves. Because if we could produce them cheaper, we would be doing that. So there’s that issue. And then there is a more interesting issue that I think is more pertinent, which is the open access to Chinese markets and the enforcement of intellectual property, forced technology transfer where the Chinese have historically not allowed US companies into China and have not paid for much of the technology they have taken from the US. I think that is the bigger issue. I think the Chinese would solve the first issue and buy a lot more natural LNG, natural gas from us, and more agricultural products and bring down the trade deficit. But it doesn’t really solve the core issue, which is paying for intellectual property and respecting copyrights…”[10]
President Trump, on the other hand, struck a more optimistic tone early this month when he tweeted, “Just had a long and very good conversation with President Xi Jinping of China. We talked about many subjects, with a heavy emphasis on Trade. Those discussions are moving along nicely with meetings being scheduled at the G-20 in Argentina. Also had good discussion on North Korea!”[11]
It’s possible that the US and China will reach a partial deal and create a roadmap for further negotiations, but a complete resolution to the disagreement between both countries is highly unlikely.
In our view, there is tremendous pressure on President Xi. While the US appears to be creating its own sphere of trade that will exclude China, the CSI 300 Index is down more than 20% year-to-date and China reported the weakest manufacturing growth since July 2016.[12] [13]
But a comprehensive resolution seems impossible at the moment. The 2017 US National Security Strategy assessment concluded that China pursues six strategies of “economic aggression”, with 50 acts, policies and practices – or “tactics” – to achieve those aims.[14] In June, White House National Trade Council Director, Peter Navarro discussed these strategies and tactics at the Hudson Institute. When alluding to the negotiations with the Chinese government, he ended his speech with the following statement: “If you’re in a negotiation, and you take 25 of these off the table in a successful negotiation, you still have 25 left.”
The comment seems ominous, and suggests that President Xi will need to offer significant concessions to President Trump in their highly anticipated meeting during the G20 later this month. But, if in fact China’s economy is deeply driven by the series of trade strategies and tactics laid out by Mr. Navarro, how much can Xi concede so much without causing severe domestic disruptions?
In sum, the completion of the 2018 midterm elections and conciliatory tone of President Trump and Speaker Pelosi seemed to have caused a sigh of relief in financial markets. Now we must turn our attention to other major macrovariables, notably the Fed and US-China trade, both of which could have significantly transformative economic effects during the next year.

Paul Hoffmeister is Chief Economist and Portfolio Manager at Camelot Portfolios, managing partner of Camelot Event-Driven Advisors, and co-portfolio manager of Camelot Event-Driven Fund (tickers: EVDIX, EVDAX).
*******
Disclosures:
• Past performance may not be indicative of future results. Therefore, no current or prospective client should assume that the future performance of any specific investment, investment strategy (including the investments and/or investment strategies recommended by the adviser), will be profitable or equal to past performance levels.
• This material is intended to be educational in nature, and not as a recommendation of any particular strategy, approach, product or concept for any particular advisor or client. These materials are not intended as any form of substitute for individualized investment advice. The discussion is general in nature, and therefore not intended to recommend or endorse any asset class, security, or technical aspect of any security for the purpose of allowing a reader to use the approach on their own. Before participating in any investment program or making any investment, clients as well as all other readers are encouraged to consult with their own professional advisers, including investment advisers and tax advisors. Camelot Portfolios LLC can assist in determining a suitable investment approach for a given individual, which may or may not closely resemble the strategies outlined herein.
• Any charts, graphs, or visual aids presented herein are intended to demonstrate concepts more fully discussed in the text of this brochure, and which cannot be fully explained without the assistance of a professional from Camelot Portfolios LLC. Readers should not in any way interpret these visual aids as a device with which to ascertain investment decisions or an investment approach. Only your professional adviser should interpret this information.
• Some information in this presentation is gleaned from third party sources, and while believed to be reliable, is not independently verified. A716
[1] “Democrats Capture Control of House; GOP Holds Senate”, by Jonathan Martin and Alexander Burns, November 6, 2018, New York Times.
[2] “How Republicans Made Gains in the Senate”, By Geoffrey Skelley, November 7, 2018, November 7, 2018.
[3] “Remarks by President Trump in Press Conference after Midterm Elections”, November 7, 2018, White House.
[4] “Nancy Pelosi Holds a Press Conference”, November 7, 2018, Fox News.
[5] “Nancy Pelosi Took Donald Trump Impeachment off the Table as Democrats Won House”, by Tim Marcin, November 7, 2018, Newsweek.
[6] Ibid.
[7] “S&P 500 and Dow Surge in Best Rally after Midterm Elections since 1982,” by Fred Imbert and Michael Sheetz, November 7, 2018, CNBC.
[8] CNBC Transcript: National Economic Council Director Larry Kudlow Speaks with CNBC’s Scott Wapner on CNBC’s ‘Fast Money Halftime Report’ Today,” October 12, 2018, CNBC.com.
[9] “The Trump Trade Strategy Is Coming into Focus. That Doesn’t Necessarily Mean It’s Going to Work,” by Neil Irwin, October 6, 2018, New York Times.
[10] “Gary Cohn Sees No Instant Cure on U.S.-China Trade Dispute,” November 7, 2018, Bloomberg.
[11] President Trump, Twitter.
[12] Bloomberg.com
[13] “China Reports Weakest Manufacturing Growth in More than Two Years,” by Huileng Tan, October 30, 2018, CNBC.
[14] Full Trasncript: White House National Trade Council Director Peter Navarro on Chinese Economic Aggression,” July 9, 2018, Hudson Institute.
Will the Fed Only Stop When Something Breaks?
By Paul Hoffmeister, Chief Economist
October 2, 2018
· With real GDP growing at +4.2% in Q2 2018, the ISM Manufacturing Index at 59.8, and jobless claims now running at nearly 206,000 and apparently still in a downtrend, the US economy is arguably strong.
· While the economy is being boosted by fiscal and regulatory levers, the Federal Reserve is pulling back on its monetary lever. At what point will the Fed stop raising interest rates? Will the Fed “thread the needle” and end its rate increases before any serious economic consequences emerge? Or, will it continue this prolonged, gradual rate hiking cycle until something breaks in the economy?
· Chairman Powell’s statements during the recent FOMC press conference suggest to us that the Fed will continue raising rates until the economy cracks slightly, or breaks.
· Given that statistical inflation is low, the Treasury curve is close to inverting, and the strong dollar seems to be creating stresses in emerging markets, we believe the Fed should pursue monetary policy like it did in 1995, by stopping short of inversion. It could be the best decision for stocks and the economy. Otherwise, the continuation of the current interest rate cycle will likely limit equity gains and create economic tail risks.
Economic Update
The US economy is, in our view, performing very well. According to the Bureau of Economic Analysis, real GDP has accelerated from +1.9% during the third quarter of 2016 to +4.2% as of the end of the second quarter 2018. The Manufacturing Index from the Institute for Supply Management stood at 59.8 in September, compared to nearly 50 during the third quarter of 2016. Furthermore, the Department of Labor reported that, as of late September, the 4-week moving average for jobless claims was almost 206,000, compared to nearly 250,000 during the third quarter of 2016, signaling a continued downtrend in the number of people receiving unemployment insurance benefits.
The economy is growing strongly, and the robust manufacturing and employment environments suggest that a significant economic slowdown isn’t on the near-term horizon. For instance, each of the last five recessions since 1980 began when the ISM Manufacturing Index was less than or equal to 50.1. And, each of the last five recessions was preceded by an upward sloping trend in jobless claims.

Arguably, improved incentives to produce spurred by lower corporate tax rates (signed into law in December 2017) and less corporate regulation (underway since January 2017) are driving much of the upturn in the economy.
Prior to last year’s reduction in the corporate tax rate to 21% (from 35%), the United States had the fourth highest statutory corporate income tax rate in the world, according to the Tax Foundation. Today, it is pegged almost two percentage points below last year’s world average of 22.96%.[1] More competitive American firms and the more attractive after-tax return potential of corporate investments are likely driving more business activity.
Also, the pace of regulation is significantly slower today than any other period since 1970. According to the Program for Economic Research on Regulation at George Mason University, federal regulations grew 0.65% during the first year of the Trump Administration. This compares to the 2.1% annual average between 1970 and 2016.[2]
Even more, the pace of reviews for significant new regulations has at the same time slowed. The Office of Information and Regulatory Affairs reviewed 60 rules deemed “economically significant” between January 21, 2017 and January 20, 2018. According to the New York Times, the last time so few rules of this kind were considered was in 1984 under President Reagan.[3]
But of course, with the economy being boosted by fiscal and regulatory levers, the Federal Reserve is pulling back on its monetary lever. The predominant question facing investors today is, at what point do higher interest rates offset today’s positive economic environment and become a serious headwind?
We appear to be getting closer to the point that Fed policy is meaningfully detrimental, and it could be signaled by today’s flattening yield curve, which is close to inverting.
An inverted yield curve has often preceded economic contractions. The New York Federal Reserve Bank, which conducts some of the leading research on the relationship between credit spreads and economic activity, states on its website: “The yield curve has predicted essentially every U.S. recession since 1950 with only one ‘false’ signal, which preceded the credit crunch and slowdown in production in 1967.”
All the more, in their seminal research in 1996, economists Arturo Estrella and Frederic Mishkin found that the spread between 10-year and 3-month Treasuries significantly outperformed other financial and macroeconomic indicators – namely the NYSE Stock Price Index, the Index of Leading Indicators, and the Stock-Watson Index – in predicting recessions two to six quarters ahead.[4] Quite simply, a narrowing of the 10-year/3-month Treasury spread could reliably signal a greater likelihood of recession.
According to the New York Federal Reserve, the narrowing of the 10-year/3-month Treasury spread from 106 basis points at the end of 2017 to 82 basis points at the end of August has increased the probability of a recession by the end of August 2019 to 14.61%. This is the highest level since late 2008. This estimate of recession starting within one year was just 4.06% at the end of December 2017.

To us, this simple yet powerful model suggests that current Fed policy is substantially increasing risks to the economy. And it begs the question, at what point will the Fed stop raising rates? Will the Fed effectively “thread the needle”; that is, will it end its rate increases before any serious economic consequences emerge? Or, will the Fed continue this prolonged, gradual rate hiking cycle until something breaks? We may have recently gotten some clues to the answer.
Fed Chairman Powell was pointedly asked this question by the Wall Street Journal’s Nick Timiraos during the FOMC press conference on September 26.
Nick Timiraos (Wall Street Journal): “Chairman Powell, given the lags of monetary policy, I want to know how you think about ending the tightening cycle. How will you know when to stop? And do you need to keep going until something in the economy breaks?”
Jerome Powell: “So the tightening cycle, as you know, is a reflection of the strength of the economy. And it’s, it’s almost three years now that we’ve been gradually increasing rates. And I think the fact that we have moved quite gradually, in a way, allows us to carefully watch incoming data in the real economy and in the financial markets to see how the economy is processing higher interest rates. And the fact that we’re moving so gradually, I think, I think it limits the long and variable lags problem because, you know, we’re being able to raise rates and wait and see how the economy absorbs these rate increases. And so far the economy has performed very well and in keeping with our expectations.”[5]
It seems, based on this answer, that Powell and the Federal Open Market Committee, in general, are counting on their gradual rate increases to both softly acclimate the economy to higher interest rates and give the Committee enough lead time to monitor how the economy and financial markets are handling them.
In a follow-up question, Paul Kiernan from Dow Jones asked Powell about what precisely Fed policymakers will be looking at to gauge the impact of rate increases.
Paul Kiernan (Dow Jones Newswires): “…I’d like to just kind of ask again. You mentioned earlier the gradual pace of rate increases will make it easier to react. But specifically what are you going to be looking to see because you’ve also mentioned, you know, that monetary policy operates with a lag, so any kind of specific sign posts that maybe we’ve reached the end of the tightening cycle or where we should stop?…”
Jerome Powell: “…Some of the things we’d be looking at to tell us whether we’re getting close to supply-side limits would be, first, does job growth slow down? A slowing down in job growth would be an indicator. You know, an unexpectedly sharp increase in wages or inflation could tell you that you’re reaching those points. You know, if headline growth slowed down, that’s another one. So all of those things would be worth taking into consideration. I think also, though, we’ve seen sometimes sharp tightening in financial conditions as we saw at the beginning of 2016 can have a substantial effect pretty quickly on our economy, if it’s a broad and significant tightening. So we would be looking for those kinds of things and many other things…”[6]
Based on Powell’s answers, it seems that Fed policymakers will choose to abandon their rate-hiking cycle when certain negative conditions, such as a deteriorating job market or tightening financial conditions, present themselves. And such conditions, arguably, present themselves when real cracks in the economy are occurring.
As a result, the Fed is likely to continue raising interest rates until the economy either cracks slightly, or breaks. This foreboding trajectory of monetary policy, we believe, will limit equity gains during the next 12-24 months.
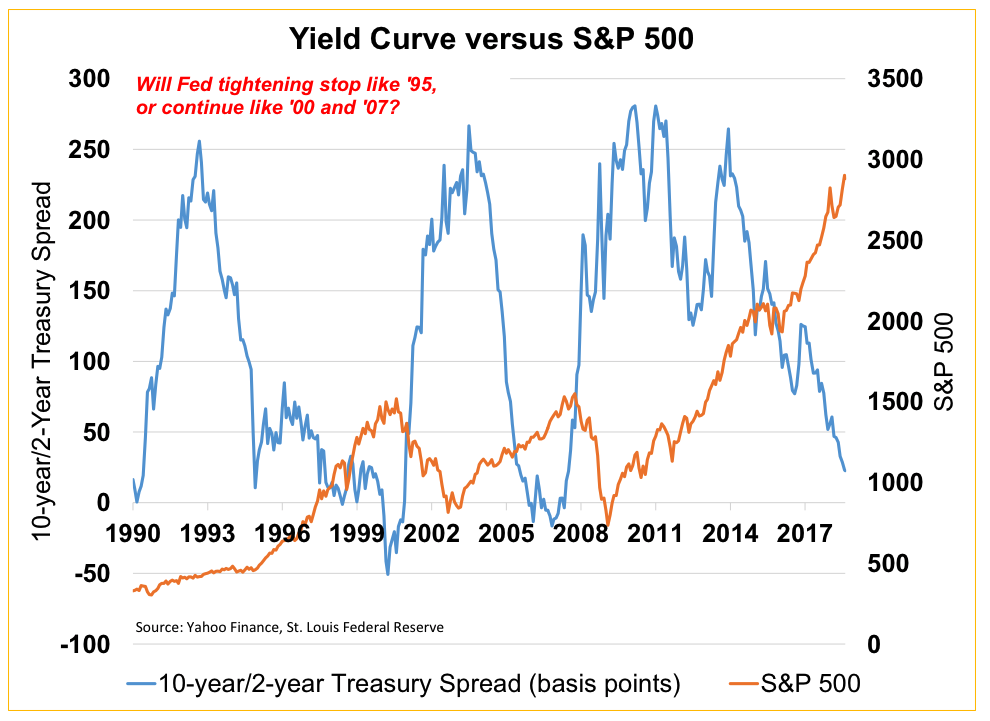
It appears that the Federal Reserve is not giving sufficient deference today to the yield curve signal, nor the stresses that the strong dollar is creating in emerging markets, which threaten to create currency crises similar to 1997-1998.
Why raise interest rates further and threaten to invert the yield curve, especially when the overall PCE inflation rate for August was 1.3% annualized?[7]
With the 10-year/2-year Treasury spread trading at nearly 23 basis points in September, it is not far from inverting. In our view, the Fed should treat interest rate policy as if it were 1995, when the Federal Reserve, by ending its rate hiking cycle, stopped short of inverting the yield curve. This policy shift coincided with a strong equity market rally and likely laid part of the foundation for the economic success of the late 1990s. Unfortunately, from Chairman Powell’s recent statements, it appears that the Fed will ominously pursue a policy course more similar to 2000 and 2007.

Paul Hoffmeister is chief economist and portfolio manager at Camelot Portfolios, managing partner of Camelot Event-Driven Advisors, and co-portfolio manager of Camelot Event-Driven Fund (tickers: EVDIX, EVDAX).
*******
Disclosures:
• Past performance may not be indicative of future results. Therefore, no current or prospective client should assume that the future performance of any specific investment, investment strategy (including the investments and/or investment strategies recommended by the adviser), will be profitable or equal to past performance levels.
• This material is intended to be educational in nature, and not as a recommendation of any particular strategy, approach, product or concept for any particular advisor or client. These materials are not intended as any form of substitute for individualized investment advice. The discussion is general in nature, and therefore not intended to recommend or endorse any asset class, security, or technical aspect of any security for the purpose of allowing a reader to use the approach on their own. Before participating in any investment program or making any investment, clients as well as all other readers are encouraged to consult with their own professional advisers, including investment advisers and tax advisors. Camelot Portfolios LLC can assist in determining a suitable investment approach for a given individual, which may or may not closely resemble the strategies outlined herein.
• Any charts, graphs, or visual aids presented herein are intended to demonstrate concepts more fully discussed in the text of this brochure, and which cannot be fully explained without the assistance of a professional from Camelot Portfolios LLC. Readers should not in any way interpret these visual aids as a device with which to ascertain investment decisions or an investment approach. Only your professional adviser should interpret this information.
• Some information in this presentation is gleaned from third party sources, and while believed to be reliable, is not independently verified.
• A672
[1] “Corporate Income Tax Rates around the World, 2017”; https://taxfoundation.org/corporate-income-tax-rates-around-the-world-2017/
[2] “Trump Says ‘No President Has Cut So Many Regulations’. Not Quite”, by Linda Qiu, February 23, 2018, New York Times.
[3] Ibid.
[4] “The Yield Curve as a Predictor of U.S. Recessions”, by Arturo Estrella and Frederic Mishkin, June 1996, Current Issues in Economics and Finance, Federal Reserve Bank of New York.
[5] FOMC Press Conference, September 26, 2018.
[6] Ibid.
[7] Source: Bureau of Economic Analysis
Will Stocks Crash if Trump Is Impeached?
September Market Commentary
By Paul Hoffmeister, Chief Economist
· As of September 4th, betting markets suggested a 45% probability of President Trump being impeached by the end of his first term.
· In 1998, prospects of President Clinton’s impeachment and possible removal from office arguably caused a nearly 15% selloff in the S&P 500.
· As we see it, the Federal Reserve’s tightening campaign and strong dollar, and the stresses they create on emerging markets, are some of the most important macroeconomic risks today. A Presidential impeachment process is an additional tail risk to consider.
Thinking about Market Implications of a Trump Impeachment
As of September 4th, Predictit betting markets suggested a 68% probability of Democrats regaining control of the House in 2019, and a 45% chance of President Trump being impeached by the end of his first term.[1]
While the House has the power to impeach the President, only the Senate can remove him from office.[2] And at the moment, Predictit markets suggest a 78% probability of Republicans maintaining control of the Senate next year.[3]
But despite the expected Republican foothold in the Senate, some political observers see a real possibility of the President being impeached if Democrats take back the House. Underscoring the seriousness of this possibility, if betting markets today are accurate, then the probability of an impeachment process in the coming years is virtually a coin flip.
This forces the question, what could happen to financial markets if President Trump is impeached? In an interview with Fox & Friends’ Ainsley Earhardt, aired on August 23, President Trump said: “If I ever got impeached, I think the market would crash, I think everybody would be very poor, because without this thinking, you would see — you would see numbers that you wouldn’t believe in reverse.”[4]
To think through the market implications, the only precedent we can examine in the modern era is the Clinton impeachment proceedings in late 1998, early 1999.

[1] “Trump Declares ‘Market Would Crash’ If Democrats Impeached Him,” by Brooke Singman, August 23, 2018, Fox News.
Based on the timeline of events in those Clinton years, it appears that much of the stock market pain occurred between the announcement of Monica Lewinsky’s immunity deal on July 28, 1998 and the release of the Ken Starr report on September 9, 1998. Based on the closing prices for the S&P 500 on July 27 (the day prior to the deal announcement) and September 10 (the day after the report’s release), the S&P 500 fell 14.6%.[5]
As CNN reported at the time, the plea deal followed a meeting between Lewinsky and Starr, in which Lewinsky admitted to having a sexual relationship with President Clinton. This reportedly contradicted sworn testimony from both Lewinsky and Clinton in the Paula Jones sexual harassment case where both denied having such a relationship.[6]
President Clinton’s impeachment process was initiated in December 1998 after the Republican-controlled House passed two articles of impeachment, for perjury and obstruction of justice. By January 1999, the trial commenced in the Senate where Republicans controlled 55 seats.[7] Given that Clinton’s removal from office required the support of two-thirds of the Senate, it seems that by late 1998, it was increasingly assured that, as many Democrats defended him, the President would not be forced out of office. Ultimately, 50 senators voted to remove Clinton on the obstruction of justice charge, while 45 voted to remove him on the perjury charge.[8] The vote didn’t come close to the required 67.
Arguably, the selloff in the S&P 500 between July and September 1998 occurred because the market was digesting the initial information of Clinton’s perceived perjury and the possibility of his removal. And over time, between September and year-end, the market seemed to assess (correctly) that the probability of Clinton’s ultimate impeachment and removal from office was very low – allowing stocks to regain their previous highs.

Credit conditions in 1998-1999 also appear to show a correlation to the Clinton impeachment events, but in a slightly different way. While stocks seemed to discount the worst of Clinton’s prospects between July and September 1998, the credit market represented by the spread between Baa and Aaa-rated corporate bonds widened almost consistently until late January, early February 1999 when Clinton’s acquittal was almost certain; and then the credit spread began to narrow.
Of course, financial markets aren’t driven by one factor alone, and there were other macro variables impacting markets during the Clinton impeachment period – namely the Russian debt default and currency crisis.
Of the critical dates associated with the Russian Crisis, two dates especially stand out.
On August 17, 1998, the Russian government announced a significant devaluation of the ruble, whereby the ruble would be allowed to fall by up to 50% to 6.00-9.50 rubles per U.S. dollar, compared to 6.27 rubles during the day prior to the announcement and from a previous band of 5.27 to 7.13.[9] At the same time, the government defaulted on short-term Treasury Bills known as GKO’s and longer-term ruble-denominated bonds known as OFZ’s.[10] Additionally, a moratorium was imposed on payments by commercial banks to foreign creditors.[11]
Then, on September 2, 1998, Russia’s central bank removed the ruble corridor and effectively allowed its currency to float freely. While on September 1 the ruble traded near 9.33 per dollar, it quickly devalued to more than 20 per dollar by September 9.[12] [13]
Importantly, though, the Russian debt default and devaluation did not appear to coincide with a serious disruption in US stock and credit markets, at least in terms of the daily prices of the S&P 500 and the Baa-Aaa credit spread around those specific dates.
On August 17, the S&P 500 actually rose 1.96%, compared to the previous day’s close. And it rose an additional 1.61% on Tuesday August 18. Additionally, the Baa-Aaa spread narrowed to 61 basis points on August 17 and 18, compared to 62 basis points on Friday August 14.[14]
Furthermore, between September 2 and September 9 as the ruble devalued from approximately 9 to more than 20 per dollar, the S&P 500 rose 1.59% from 990.48 to 1006.20, while the Baa-Aaa spread traded around 64-65 basis points.[15]
Of course, this is not to say that the Russian default and currency crisis had no impact on certain segments of the market in 1998. Indeed, the investment losses at Long-Term Capital Management in August and September 1998 appeared to be related to the events in Russia, prompting the Federal Reserve to step in and facilitate a capital infusion.[16]
But parsing through the news flow that year suggests that the events leading up to the Clinton impeachment may have been a key variable behind the nearly 15% selloff in the S&P 500 and more than 40 basis point widening in the Baa-Aaa credit spread.
In this context, as we look at the market environment today, we continue to believe that the Federal Reserve’s tightening campaign and the strong dollar (and the stresses they may create for emerging markets) are some of the most important macroeconomic risks facing financial markets. And, based on the history of 1998, a Presidential impeachment process may be an additional tail risk to consider.
Paul Hoffmeister is chief economist of Camelot Portfolios, managing member of Camelot Event-Driven Advisors, and co-portfolio manager of Camelot Event-Driven Fund (tickers: EVDIX, EVDAX).
*******
Disclosures:
• Past performance may not be indicative of future results. Therefore, no current or prospective client should assume that the future performance of any specific investment, investment strategy (including the investments and/or investment strategies recommended by the adviser), will be profitable or equal to past performance levels.
• This material is intended to be educational in nature, and not as a recommendation of any particular strategy, approach, product or concept for any particular advisor or client. These materials are not intended as any form of substitute for individualized investment advice. The discussion is general in nature, and therefore not intended to recommend or endorse any asset class, security, or technical aspect of any security for the purpose of allowing a reader to use the approach on their own. Before participating in any investment program or making any investment, clients as well as all other readers are encouraged to consult with their own professional advisers, including investment advisers and tax advisors. Camelot Portfolios LLC can assist in determining a suitable investment approach for a given individual, which may or may not closely resemble the strategies outlined herein.
• Any charts, graphs, or visual aids presented herein are intended to demonstrate concepts more fully discussed in the text of this brochure, and which cannot be fully explained without the assistance of a professional from Camelot Portfolios LLC. Readers should not in any way interpret these visual aids as a device with which to ascertain investment decisions or an investment approach. Only your professional adviser should interpret this information.
• Some information in this presentation is gleaned from third party sources, and while believed to be reliable, is not independently verified.
A678
[1] PredictIt.org.
[2] “An Overview of the Impeachment Process”, by T.J. Halstead, Legislative Attorney, American Law Division, April 20, 2005, Congressional Research Service, Library of Congress.
[3] Predicit.org.
[4] “Trump Declares ‘Market Would Crash’ If Democrats Impeached Him,” by Brooke Singman, August 23, 2018, Fox News.
[5] Data Source: Yahoo Finance.
[6] “Lewinsky Strikes Far-Reaching Immunity Deal”, by Wolf Blitzer and Bob Franken, CNN AllPolitics, July 28, 1998.
[7] “Clinton Impeachment Timeline”, By Patrick Barkham, November 18, 1998, The Guardian.
[8] “How the Senators Voted on Impeachment”, February 12, 1999, CNN ALLPolitics.
[9] “Russia Acts to Fix Sinking Finances”, by Celestine Bohlen, August 18, 1998, New York Times.
[10] Ibid.
[11] Ibid.
[12] “A Case Study of a Currency Crisis”, by Abbigail Chiodo and Michael Owyang, November/December 2002, St. Louis Federal Reserve Bank.
[13] Data Source: Deutsche Bundesbank.
[14] Data Source: Yahoo Finance and St. Louis Federal Reserve Bank.
[15] Data Source: Deutsche Bundesbank.
[16] “Near Failure of Long-Term Capital Management”, November 22, 2013, Federal Reserve History, Federal Reserve Bank of Richmond.