Yield Curve Wants Rate Cuts

by Paul Hoffmeister, Portfolio Manager and Chief Economist

With recent economic reports showing inflation falling and unemployment rising, the Federal Reserve appears to be on the verge of cutting interest rates before the end of the year. 

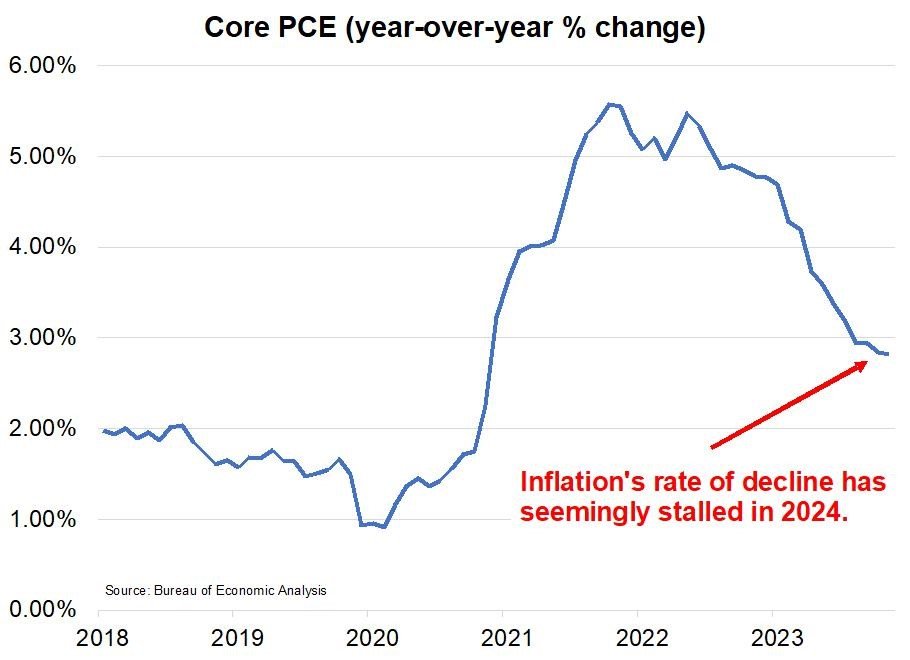
Specifically, the core PCE inflation gauge shows that as of May, year-over-year inflation rose 2.6%. Inflation pressures had been steadily declining since reaching a high of 5.5% in 2022, but stalled briefly around 2.8% early this year. Now, confidence has grown that inflation’s decline has reasserted itself and is trending toward the Fed’s long-term goal of 2%. (Bureau of Economic Analysis)

At the same time, the unemployment rate stood at 4.1% in June. After bottoming at 3.4% in early 2023, the Fed’s interest rate increases of the last two years are weighing on the economy. (Bureau of Labor Statistics)

Within the context of this recent data, Fed Chairman Powell told Congress last week that the United States is “no longer an overheated economy” and the “labor market appears to be fully back in balance”. (“US economy no longer overheated, Fed’s Powell tells Congress”, by Howard Schneider and Ann Saphir, Reuters, July 9, 2024.) As a result, the fed funds futures market expects that, by year-end, the Fed will cut the funds rate by 50 basis points from its current 5.25%-5.5% to 4.75%-5.0%.

While we believe the dovish shift at the Fed is welcome news and important for markets and the economy, the recent upturn in the unemployment rate is particularly concerning because it suggests a high probability of a looming recession. 

According to the “Sahm Rule”, developed by former Fed economist Claudia Sahm, when the unemployment rate rises at least half a percentage point (0.50%) above its low point in the past year, a recession has begun. What does this rule look like today? After the recent employment data, the Sahm Rule rose to 0.43%; very close to the 0.50% threshold.

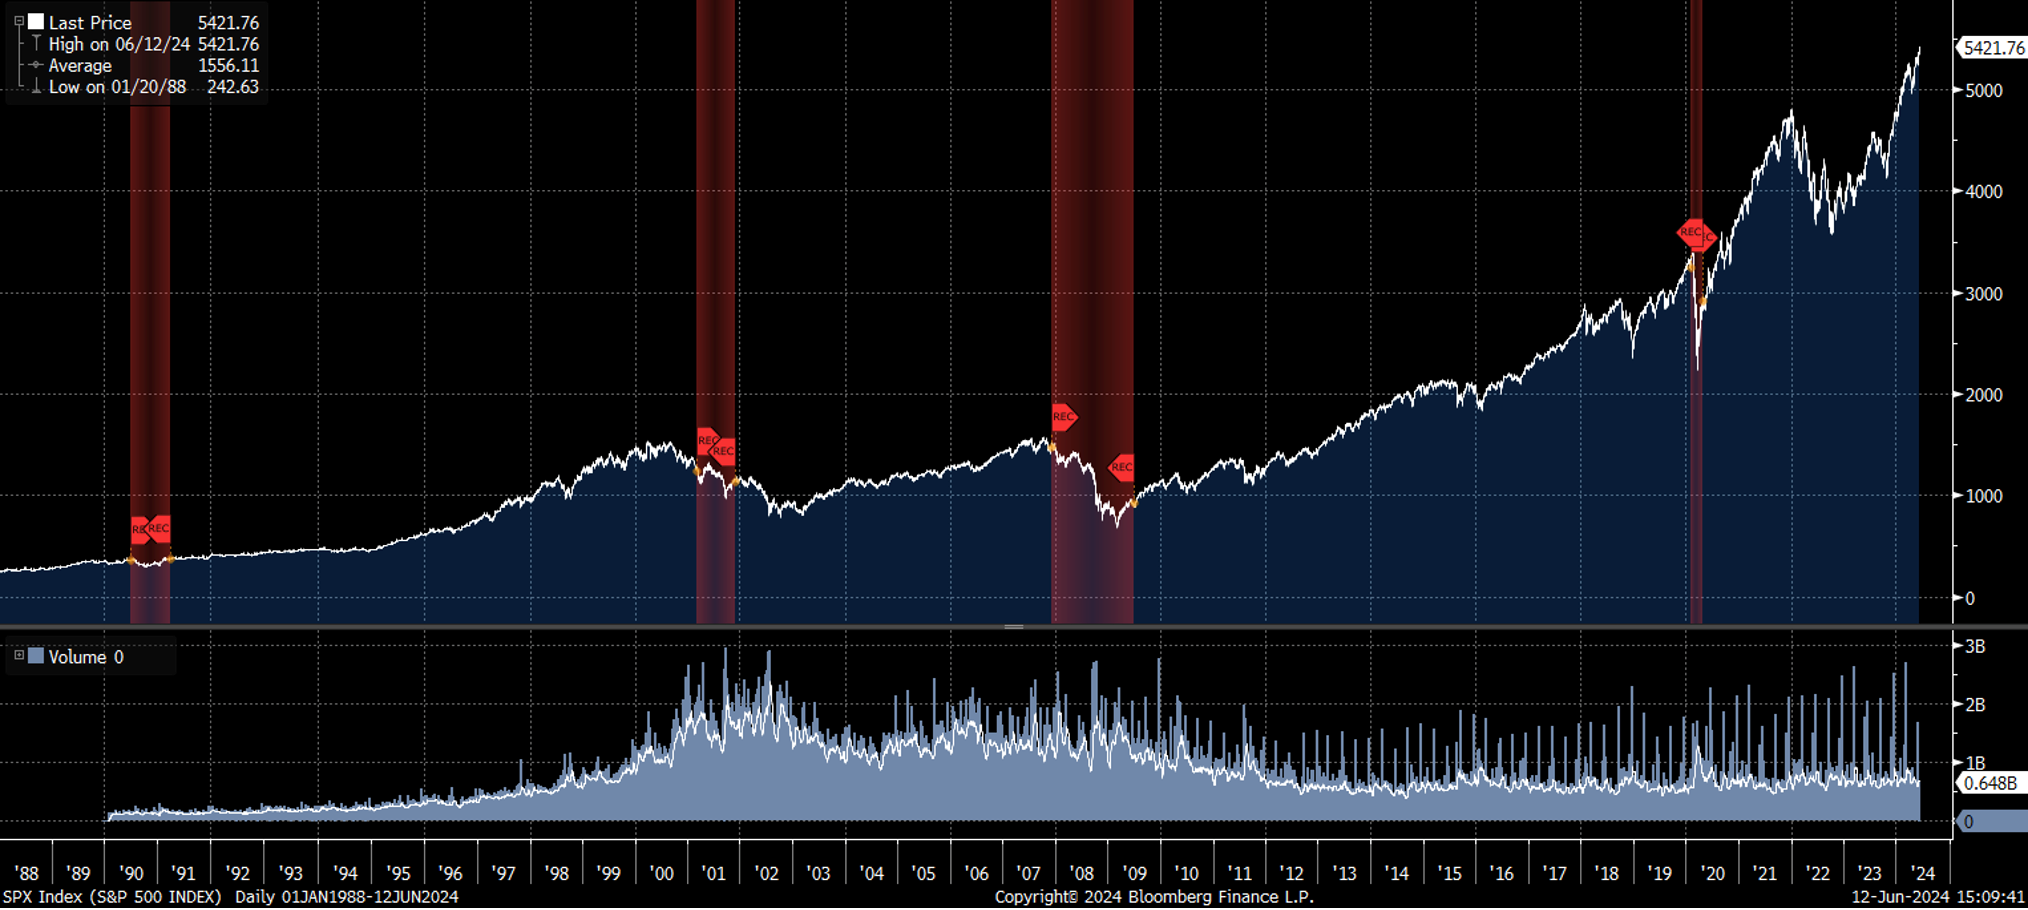
Chart of Core PCE year-over-year inflation (orange line) versus the U.S. unemployment rate (white line); recession periods highlighted in red. Source: Bloomberg.

Simply looking at the last 25 years, the recent increase in unemployment looks similar to the months before the 2001 and 2008-2009 recessions. Today, there are almost 800,000 more people unemployed compared to a year ago, and with short-term interest rates currently in restrictive territory AS WELL AS the likelihood that the lagged effects of the last two years of tight monetary policy will weigh further on the economy, there appears to be an increasingly negative momentum in the economy. 

Some important questions today are how much momentum is there to the current economic slowdown? And, will the expected interest rate cuts quickly abate that momentum?

Chart of the 3-month/10-year Treasury spread (dotted white line), core PCE year-over-year inflation (orange line), and the U.S. unemployment rate (white line); recession periods highlighted in red. Source: Bloomberg.

Historically, the yield curve, especially the 3-month/10-year Treasury spread, has been a relatively useful leading indicator of economic activity. Today, it stands around -116 basis points. In our view, the story it currently tells is that an economic contraction is on the near-term horizon, and the Fed is arguably “too tight” -- by at least 100-125 basis points. 

Unfortunately, it’s generally expected that the funds rate will only be reduced by about 50 basis points by year-end. And according to the FOMC’s economic projections published last month, the median expectation among policymakers is that the funds rate will fall to 3.9%-4.4% by year-end 2025, which is a year and a half away.

Putting all the clues and evidence together, it’s welcome news that the Fed appears to be on the verge of cutting interest rates in the coming months because the economy appears to be slowing. And as we see it, the forward-looking yield curve seems to suggest that today’s negative economic momentum will be significant enough to push the economy into contraction (recession); so the rate cuts couldn’t come fast enough.    

Paul Hoffmeister is Chief Economist and Portfolio Manager at Camelot Portfolios, managing partner of Camelot Event-Driven Advisors (CEDA), and co-portfolio manager of the Camelot Event-Driven Fund (EVDIX • EVDAX).

Camelot Event-Driven Advisors LLC | 1700 Woodlands Drive | Maumee, OH 43537 // B575  

Disclosures:
•       Past performance may not be indicative of future results. Therefore, no current or prospective client should assume that the future performance of any specific investment, investment strategy (including the investments and/or investment strategies recommended by the adviser), will be profitable or equal to past performance levels.
•       This material is intended to be educational in nature, and not as a recommendation of any particular strategy, approach, product or concept for any particular advisor or client.  These materials are not intended as any form of substitute for individualized investment advice.  The discussion is general in nature, and therefore not intended to recommend or endorse any asset class, security, or technical aspect of any security for the purpose of allowing a reader to use the approach on their own.  Before participating in any investment program or making any investment, clients as well as all other readers are encouraged to consult with their own professional advisers, including investment advisers and tax advisors.  Camelot Event Driven Advisors can assist in determining a suitable investment approach for a given individual, which may or may not closely resemble the strategies outlined herein.
•       Any charts, graphs, or visual aids presented herein are intended to demonstrate concepts more fully discussed in the text of this brochure, and which cannot be fully explained without the assistance of a professional from Camelot Portfolios LLC.  Readers should not in any way interpret these visual aids as a device with which to ascertain investment decisions or an investment approach.  Only your professional adviser should interpret this information.
•       Some information in this presentation is gleaned from third party sources, and while believed to be reliable, is not independently verified.
•       Camelot Event-Driven Advisors, LLC, is registered as an investment adviser with the United States Securities and Exchange Commission. Registration as an investment adviser does not imply any certain degree of skill or training. Camelot Event-Driven Advisors, LLC’s disclosure document, ADV Firm Brochure is available at http://adviserinfo.sec.gov/firm/summary/291798


Copyright © 2024 Camelot Event-Driven Advisors, All rights reserved.

Unemployment, Recessions, and the S&P 500

by Paul Hoffmeister, Portfolios Manager and Chief Economist

Last month, we explained that interest rates were expected to stay higher for longer because inflation had become stubborn. Core PCE was holding near 2.8% in recent months, after declining nicely from 5.5% since 2022. As a result, the market had come to expect only one or two quarter point rate cuts by year-end, compared to as many as four or five at the beginning of this year. 

We also added that the Fed’s reaction function for deciding whether and to what degree to cut rates later this year will likely be predicated on the core PCE falling convincingly toward 2% and/or the unemployment rate jumping meaningfully higher than 4%. 

Last Friday, the unemployment rate increased to 4%; a level not seen since Q1 2022. From an economic and market perspective, the level may not be as important as the rate of change. A year ago during Q2 2023, the unemployment rate hovered around 3.6%. The reason that’s important is because, based on the Sahm Rule, it’s likely that the US economy will be entering recession if the rate soon reaches 4.1-4.2%. (According to the St. Louis Federal Reserve, the Sahm Rule “signals the start of a recession when the three-month moving average of the national unemployment rate rises by 0.50 percentage points or more relative to the minimum of the three-month averages from the previous 12 months.")

While there has recently been some contradictory labor market data indicating that employment is actually increasing, we believe that the rising unemployment rate is closer to the truth and that the labor market and economy are weakening at the margins. In our view, this would be much more consistent with a slew of macroeconomic indicators and signals showing deterioration; such as the inverted yield curve, relatively weak leading economic indicators, cautious lending surveys, weak regional Fed data, and qualitative feedback published in the Fed Beige Book from economic participants across the country.

U.S. Unemployment Rate (recessions highlighted in red). Source: Bloomberg.

The chart above illustrates the unemployment rate since 1988 and periods of recession (highlighted in red columns). Indeed, upturns in the rate like we’re seeing today, strongly suggest an economic contraction on the horizon. 

Notwithstanding, why does the question of recession matter to investors? After all, some US stock market indices (and other foreign indices) have recently hit all-time highs, certain credit spreads are relatively tight, and credit market conditions are seemingly excellent. 

It’s relevant because economic contraction tends to correlate with not only slower earnings growth but also significant downside risk in equity indices. For example, within the context of the 2001 recession, quarterly earnings in the S&P 500 fell from $14.68 in Q3 2000 to $10.43 in Q1 2002. (Bloomberg) Within the context of the 2007-2009 recession, quarterly earnings fell from $24.55 in Q3 2007 to as low as $5.87 in Q1 2009. (Bloomberg) Based on the historical evidence, economic contractions can meaningfully impact the S&P 500. 

Naturally, if earnings decline, stock valuations and stock prices are threatened. Between Q3 2000 and Q1 2002, the S&P 500 lost nearly 28%. Between Q3 2007 and Q1 2009, it lost almost 56%.

S&P 500 Index (recessions highlighted in red). Source: Bloomberg.

A lot of attention is being paid on Fed policy, inflation and employment data. Of course, a 2024-2025 recession isn’t pre-determined. But the history of the last few decades suggests that a slowly deteriorating labor market, which is what we might be seeing now, raises the specter of recession and weaker equity markets.

Click Below to Register for:

CEDA’s Monthly Event-Driven Call!

2nd Tuesday each month. 2pm with 2PMs. 22 Minutes.

Paul Hoffmeister is Chief Economist and Portfolio Manager at Camelot Portfolios, managing partner of Camelot Event-Driven Advisors (CEDA), and co-portfolio manager of the Camelot Event-Driven Fund (EVDIX • EVDAX).

Camelot Event-Driven Advisors LLC | 1700 Woodlands Drive | Maumee, OH 43537 // B573 
 
Disclosures:
•       Past performance may not be indicative of future results. Therefore, no current or prospective client should assume that the future performance of any specific investment, investment strategy (including the investments and/or investment strategies recommended by the adviser), will be profitable or equal to past performance levels.
•       This material is intended to be educational in nature, and not as a recommendation of any particular strategy, approach, product or concept for any particular advisor or client.  These materials are not intended as any form of substitute for individualized investment advice.  The discussion is general in nature, and therefore not intended to recommend or endorse any asset class, security, or technical aspect of any security for the purpose of allowing a reader to use the approach on their own.  Before participating in any investment program or making any investment, clients as well as all other readers are encouraged to consult with their own professional advisers, including investment advisers and tax advisors.  Camelot Event Driven Advisors can assist in determining a suitable investment approach for a given individual, which may or may not closely resemble the strategies outlined herein.
•       Any charts, graphs, or visual aids presented herein are intended to demonstrate concepts more fully discussed in the text of this brochure, and which cannot be fully explained without the assistance of a professional from Camelot Portfolios LLC.  Readers should not in any way interpret these visual aids as a device with which to ascertain investment decisions or an investment approach.  Only your professional adviser should interpret this information.
•       Some information in this presentation is gleaned from third party sources, and while believed to be reliable, is not independently verified.
•       Camelot Event-Driven Advisors, LLC, is registered as an investment adviser with the United States Securities and Exchange Commission. Registration as an investment adviser does not imply any certain degree of skill or training. Camelot Event-Driven Advisors, LLC’s disclosure document, ADV Firm Brochure is available at http://adviserinfo.sec.gov/firm/summary/291798

Copyright © 2024 Camelot Event-Driven Advisors, All rights reserved.

Higher for Longer; Early Signs of Pain

by Paul Hoffmeister, Chief Economist

Interest rates will stay higher for longer. Following its April 30-May 1 meeting, the FOMC made clear that inflation has not sufficiently fallen toward its 2% target. Combined with the strong labor market and relatively resilient economic growth, the Committee maintained that it’ll maintain its current 5.25%-5.5% fed funds target, while signaling economic and inflation data will steer the path of interest rates. There’s even some chatter that the Fed might need to raise interest rates if inflation exceeds near-term forecasts.

In a barrage of Fed speeches since the decision, some officials have given life to that scenario. Governor Michelle Bowman stated, “While the current stance of monetary policy appears to be at a restrictive level, I remain willing to raise the federal funds rate at a future meeting should the incoming data indicate that progress on inflation has stalled or reversed.” Minneapolis Fed President Neel Kashkari hinted at the possibility if inflation remained stubborn. Richmond Fed President Thomas Barkin stated that while the economy ended 2023 in a good place, “…early 2024 inflation data has been disappointing to those who thought that the inflation fight was behind us.”

As a result, we’ve seen a major about-face in the Fed outlook since Chairman Powell surprised markets last December with his dovish pivot. Since then, the expectation by financial markets for where the funds rate will stand at the end of 2024 has jumped from 4%-4.25% to around 5%. The key development during the last five months has been the fact that the decline in inflation has slowed. In 2023, the core PCE inflation gauge fell from 4.9% to 2.9%; but this year, it’s stubbornly holding around 2.8%-2.9%. With the unemployment rate at 3.8%, stock indices near record highs, and credit spreads relatively tight, the Fed will remain focused on slowing economic growth further in order to also slow the current pace of price increases.

The Fed’s reaction function during the second half of this year will likely be predicated on where PCE and unemployment inflect. If core PCE broke below 2.8% and sufficiently trended to the low 2% range, then the Fed could finally pursue that dovish pivot. Another scenario for rate cuts might occur if unemployment broke above 4%; as a rate in the low 4% range would likely indicate the beginning of recession. Absent a meaningful decline in inflation or rise in unemployment, the Fed would likely need a major unraveling in financial market conditions -- such as a significant sell-off in stocks or widening in credit spreads -- to ignore stubborn inflation data and pursue rate cuts.

While the United States is treading water economically amidst the post-pandemic interest rate-hiking cycle, the most pronounced economic pain in the world is in China -- primarily in its real estate sector -- and now in Europe. Thus far, the UK, Ireland and Finland are in recession; France and Germany are seemingly teetering into contraction.

Not surprisingly in March, the Swiss National Bank was the first major, Western central bank to cut rates. And just last week, Sweden’s Riksbank followed with its own cut; and the Bank of England is signaling that it’s prepared to do so as well.

So, while the United States is seemingly holding up amidst today’s interest rate shock and the Fed is intent on keeping rates higher for longer, we’re seeing other central banks finally pivoting to relieve their respective economies from their multi-year chokehold.

Japan, the fourth largest economy in the world behind Germany, is also in recession today. Interestingly, the most acute effect of the Fed’s recent hawkish bias appears to be in the devaluation of the Japanese yen.

In early 2022, the yen traded near 115 per US dollar; today, it’s near 160. This major depreciation appears to be occurring in lockstep with Fed rate expectations. The weakness may indeed be caused by the “carry trade” where international traders are exchanging yen into dollars for a higher interest rate, not to mention increasing pressure on the weak Japanese economy from slowing growth externally (China and the United States are its two largest export markets). Given this currency-monetary policy relationship in recent years, it’s likely that Japan will continue to face its slow-rolling currency crisis as the Fed pursues its hawkish policy bias.

In sum, the effects of the global economy’s two-year interest rate shock is starting to show itself, with creeping recessions and emerging currency extremes. We’re seeing things “break” a little bit. Notwithstanding, US financial conditions are seemingly holding up so far, and with inflation refusing to slow down even more, the Fed is telegraphing that it’ll try to choke growth stateside a little longer to squeeze inflation further.

DIAL IN FOR OUR QUARTERLY
EVENT-DRIVEN CALL
3rd Wednesday of every quarter at 2:00pm EST

REGISTER FOR CALL

Paul Hoffmeister is chief economist and portfolio manager at Camelot Portfolios, managing partner of Camelot Event-Driven Advisors, and co-portfolio manager of the Camelot Event-Driven Fund  (tickers: EVDIX, EVDAX).

Camelot Event-Driven Advisors LLC | 1700 Woodlands Drive | Maumee, OH 43537 // B571
Disclosures:
•       Past performance may not be indicative of future results. Therefore, no current or prospective client should assume that the future performance of any specific investment, investment strategy (including the investments and/or investment strategies recommended by the adviser), will be profitable or equal to past performance levels.
•       This material is intended to be educational in nature, and not as a recommendation of any particular strategy, approach, product or concept for any particular advisor or client.  These materials are not intended as any form of substitute for individualized investment advice.  The discussion is general in nature, and therefore not intended to recommend or endorse any asset class, security, or technical aspect of any security for the purpose of allowing a reader to use the approach on their own.  Before participating in any investment program or making any investment, clients as well as all other readers are encouraged to consult with their own professional advisers, including investment advisers and tax advisors.  Camelot Event Driven Advisors can assist in determining a suitable investment approach for a given individual, which may or may not closely resemble the strategies outlined herein.
•       Any charts, graphs, or visual aids presented herein are intended to demonstrate concepts more fully discussed in the text of this brochure, and which cannot be fully explained without the assistance of a professional from Camelot Portfolios LLC.  Readers should not in any way interpret these visual aids as a device with which to ascertain investment decisions or an investment approach.  Only your professional adviser should interpret this information.
•       Some information in this presentation is gleaned from third party sources, and while believed to be reliable, is not independently verified.
•       Camelot Event-Driven Advisors, LLC, is registered as an investment adviser with the United States Securities and Exchange Commission. Registration as an investment adviser does not imply any certain degree of skill or training. Camelot Event-Driven Advisors, LLC’s disclosure document, ADV Firm Brochure is available at http://adviserinfo.sec.gov/firm/summary/291798

Copyright © 2024 Camelot Event-Driven Advisors, All rights reserved.

Multiple Expansion & Tightening Credit Spreads

by Paul Hoffmeister, Chief Economist

Some of the biggest surprises of the last year have been the multiple expansion we’ve seen in the S&P 500, as well as the dramatic tightening of credit spreads. During the last 12 months (through March 2024), S&P 500 earnings have grown approximately 6.8% while the stock index has rallied nearly 27%. As a result, the S&P’s price-to-earnings ratio has climbed four points from almost 19x to 23x. At the same time, the spread between Moody’s Baa and Aaa-rated bonds has narrowed from approximately 120 basis points to 75 today. This spread shows the difference in what investors demand in compensation for loaning money to companies with moderate credit risk and those with the highest credit quality. Both indicate massive risk appetites among investors today.

This multiple expansion and credit tightening is quite remarkable, historically speaking. Since 1993, the average P/E ratio for the S&P 500 has been 18.7 whereas the tightest that the Baa-Aaa spread tends to get is somewhere between 55 and 75 basis points. Today, stocks are meaningfully more expensive than usual, and credit markets are in a zone typical of some of our best economic periods.

To be sure, the market multiple has been higher in the past and credit spreads have been a little tighter. And, it’s arguably a stretch to say that the market is priced for perfection. But financial markets are pricing in A LOT of optimism. It very well could be that the market believes that Jerome Powell and Co. are successfully threading the needle, by modulating interest rates in almost perfect harmony with the economy. And it could be that investors today are expecting the current Fed pause and possible rate cuts later this year will enable growth to continue or even improve, while at the same allowing inflation to drift lower to the Fed’s 2% target.

What makes today’s “market exuberance” so surprising is the breadth and magnitude of the risks that we see: Ukraine, the Middle East (Hamas, Hezbollah, Iran), commercial real estate, bank challenges, recently higher-than-expected inflation, the federal deficit, and interest costs on the national debt that are about to seemingly explode. Indeed, these risks could subside, and market optimism today could be justified. Notwithstanding, it seems that a lot of things need to go right for risk assets to maintain current price levels and appreciate further.

In the current opportunity set between stocks and bonds, we believe Treasury bonds are more attractive than stocks. Thanks to years of the Fed pushing up Treasury yields and investors recently marking up the value of equities, we face a somewhat unusual situation where the 10-year Treasury is yielding almost what the S&P 500 is yielding.

At a 22.8 P/E ratio, the earnings yield for the S&P 500 is 4.39%. Meanwhile, the 10-year Treasury yield is yielding approximately 4.35%. This means that there is less than 5 basis points in equity risk premium today. The average has been 2.4% since 2000. Today’s low equity risk premium underscores how expensive stocks are today and how little equity investors are being paid to take on equity risk. As we see it, equity investors will need earnings to grow meaningfully in order to generate sizeable returns in the coming years. That’s if, of course, today’s known and unknown risks don’t materialize.

DIAL IN FOR OUR QUARTERLY

EVENT-DRIVEN CALL

3rd Wednesday of every quarter at 2:00pm EST

REGISTER FOR CALL

Paul Hoffmeister is chief economist and portfolio manager at Camelot Portfolios, managing partner of Camelot Event-Driven Advisors, and co-portfolio manager of the Camelot Event-Driven Fund  (tickers: EVDIX, EVDAX).

Camelot Event-Driven Advisors LLC | 1700 Woodlands Drive | Maumee, OH 43537 // B551


Disclosures:
•       Past performance may not be indicative of future results. Therefore, no current or prospective client should assume that the future performance of any specific investment, investment strategy (including the investments and/or investment strategies recommended by the adviser), will be profitable or equal to past performance levels.
•       This material is intended to be educational in nature, and not as a recommendation of any particular strategy, approach, product or concept for any particular advisor or client.  These materials are not intended as any form of substitute for individualized investment advice.  The discussion is general in nature, and therefore not intended to recommend or endorse any asset class, security, or technical aspect of any security for the purpose of allowing a reader to use the approach on their own.  Before participating in any investment program or making any investment, clients as well as all other readers are encouraged to consult with their own professional advisers, including investment advisers and tax advisors.  Camelot Event Driven Advisors can assist in determining a suitable investment approach for a given individual, which may or may not closely resemble the strategies outlined herein.
•       Any charts, graphs, or visual aids presented herein are intended to demonstrate concepts more fully discussed in the text of this brochure, and which cannot be fully explained without the assistance of a professional from Camelot Portfolios LLC.  Readers should not in any way interpret these visual aids as a device with which to ascertain investment decisions or an investment approach.  Only your professional adviser should interpret this information.
•       Some information in this presentation is gleaned from third party sources, and while believed to be reliable, is not independently verified.
•       Camelot Event-Driven Advisors, LLC, is registered as an investment adviser with the United States Securities and Exchange Commission. Registration as an investment adviser does not imply any certain degree of skill or training. Camelot Event-Driven Advisors, LLC’s disclosure document, ADV Firm Brochure is available at http://adviserinfo.sec.gov/firm/summary/291798

Copyright © 2024 Camelot Event-Driven Advisors, All rights reserved.

An Economy of Contradictions

by Paul Hoffmeister, Chief Economist

The global economy and financial markets are experiencing an unusual set of contradictions. As many of the world’s major central banks have pursued aggressive interest rate increases to stem the post-Covid inflation, major macro indicators appear to be screaming that an economic downturn is in sight. The sovereign yield curves for the United States, Canada, United Kingdom, France and Germany are each inverted. In the United States, the Index of Leading Economic Indicators has declined for 22 consecutive months between March 2022 and January 2024. And money supply measured by M2, considered by some to be the “lifeblood of the economy”, has recently contracted more than at any time since the Great Depression.

And yet, major stock indices from the United States to Canada, Europe and Japan are trading near all-time highs. U.S. real GDP grew 2.5% in 2023, and the unemployment rate is less than 4%.

Dark clouds appear on the horizon, but many aspects of the economy and financial markets today appear highly resilient. So, what’s behind these contradictions? And should we ignore the macro indicators and trust seemingly forward-looking market signals?

In our view, massive spending by the U.S. government and consumers is supporting the economy so far. Furthermore, we’re seeing an AI boom that has ignited mega-cap tech stocks, which has in turn helped to boost headline stock indices.

With regard to the economy, U.S. government spending has been offsetting a lot of the slowdown that the Federal Reserve has been trying to engineer through their interest rate shock campaign. In fiscal year 2023, U.S. federal government net outlays were more than $6.1 trillion. This is nearly as much as the $6.5 and $6.8 trillion in outlays during the peak pandemic years of 2020 and 2021; and it’s much more than 2019 (pre-Covid) outlays of $4.4 trillion.

Just as Covid emergency spending helped to keep the economy afloat amidst widespread lockdowns between 2020 and 2022, the continued elevated spending by the federal government is helping the economy to withstand the headwinds of higher interest rates during the last two years.

Consumers aren’t holding back their spending either. The personal savings rate in the United States was a relatively low 3.7% as of December 2023. Between 2015 and 2020, the personal savings rate generally ranged between 5% and 8%. Today’s historically low savings rate indicates that consumers are stretching themselves financially to stay afloat. At the margin, this is helping to support economic activity.

While we’re seeing monetary and fiscal policies act against each other and consumers reaching deeper into their pockets to make ends meet, big tech has been seemingly in its own world during the last year thanks to the AI boom.

As chatbots went viral last year, major tech companies such as Microsoft, Alphabet and Amazon invested heavily into companies such as OpenAI and Anthropic. In many respects, these investments steered AI-related business, which requires massive amounts of cloud computing power, to these cloud service providers, locking in significant, new revenue streams. Of course, these cloud services companies -- as well as others looking to leverage AI -- rushed to buy the advanced computing chips produced by the likes of companies such as Nvidia.

This nascent technology and related business led to massive rallies in 2023 for the AI-related stocks. For example, stock prices for Microsoft, Alphabet and Amazon were up more than 50% for the year, while Nvidia’s share price appreciated nearly 250%, seemingly becoming a household name.

Zooming out and looking at the global economy from a high level provides more context of today’s economic environment. There is indeed a global slowdown underway, which arguably validates the major macro indicators. China’s economy is in distress (with ground zero being its property sector); Japan, Germany and the UK have fallen into recession; and Canada is close to it, having grown 1% in Q4 after contracting -0.5% in Q3. Indeed, the global interest rate shock appears to be having its intended effect.

While the U.S. economy seems to be an exception so far, its growth environment is not necessarily robust. According to Zerohedge, earnings in the last quarter grew a better than expected 8% year-over-year; but without the Magnificent 7, earnings declined -1.6%. Similarly, while the S&P 500 returned nearly 24% in 2023, were it not for the big returns in the “Magnificent 7”, the S&P would have returned nearly 12%. Indeed, we seem to have a bifurcated economy today, where a small handful of megacap tech stocks are currently prospering but most companies are experiencing a slowdown.

The big question today is, will the United States be able to buck the trend of what seems to be a synchronized global economic slowdown?

A soft-landing in the United States is possible; Alan Greenspan achieved it in 1995. Stocks seem to be pricing for this optimistic scenario.

With the S&P 500 trading near 5100 and expected to earn $241 this year (forecast by Goldman Sachs), its P/E ratio is 21.2. This means that stocks are currently paying an earnings yield of 4.7%. Meanwhile, the 10-year Treasury yield is approximately 4.1%. As such, at 60 basis points, there is very little equity risk premium in the marketplace today. Historically, this risk premium fluctuates, and during the last 15 years, it has averaged almost 3%. Arguably, there isn’t a lot of risk or “cushion” priced into stock prices today. It further suggests that investors are expecting economic growth to persist and earnings growth to accelerate in the coming years.

In our view, however, the economic policy status quo isn’t conducive for a soft-landing and enabling the U.S. to downshift and avoid recession. With interest rates as high as they’ve been in decades, the higher cost of capital is taxing most of the world, which is starting to become apparent.

Could AI boost productivity and growth to such a degree to keep the economy afloat? Sure, but we’re skeptical. Even the emergence of the internet didn’t prevent the recession that started in late 2000.

For a soft-landing scenario, it would likely require some combination of aggressive interest rate cuts from the Fed and proportional cuts from other major central banks, a continuation of today’s historic federal spending, and pro-growth tax cuts to reignite animal spirits throughout the economy.

Unfortunately, Fed officials appear reluctant to cut rates too soon, particularly given recent inflation data that has come in higher-than-expected. Furthermore, ballooning deficits and ever higher interest payments on the national debt are starting to catch the attention of legislators in Washington; and tax cuts are nowhere on the horizon.

Absent major policy shifts, it appears that the wheels of the global economy are grinding slower and slower. But to a certain extent, massive spending and today’s AI boom appear to be offsetting this grind lower, and market prices seem to be optimistic that they’ll succeed.

DIAL IN FOR OUR QUARTERLY
EVENT-DRIVEN CALL
3rd Wednesday of every quarter at 2:00pm EST

REGISTER FOR CALL

Paul Hoffmeister is chief economist and portfolio manager at Camelot Portfolios, managing partner of Camelot Event-Driven Advisors, and co-portfolio manager of the Camelot Event-Driven Fund  (tickers: EVDIX, EVDAX).

Camelot Event-Driven Advisors LLC | 1700 Woodlands Drive | Maumee, OH 43537 // B549


Disclosures:
•       Past performance may not be indicative of future results. Therefore, no current or prospective client should assume that the future performance of any specific investment, investment strategy (including the investments and/or investment strategies recommended by the adviser), will be profitable or equal to past performance levels.
•       This material is intended to be educational in nature, and not as a recommendation of any particular strategy, approach, product or concept for any particular advisor or client.  These materials are not intended as any form of substitute for individualized investment advice.  The discussion is general in nature, and therefore not intended to recommend or endorse any asset class, security, or technical aspect of any security for the purpose of allowing a reader to use the approach on their own.  Before participating in any investment program or making any investment, clients as well as all other readers are encouraged to consult with their own professional advisers, including investment advisers and tax advisors.  Camelot Event Driven Advisors can assist in determining a suitable investment approach for a given individual, which may or may not closely resemble the strategies outlined herein.
•       Any charts, graphs, or visual aids presented herein are intended to demonstrate concepts more fully discussed in the text of this brochure, and which cannot be fully explained without the assistance of a professional from Camelot Portfolios LLC.  Readers should not in any way interpret these visual aids as a device with which to ascertain investment decisions or an investment approach.  Only your professional adviser should interpret this information.
•       Some information in this presentation is gleaned from third party sources, and while believed to be reliable, is not independently verified.
•       Camelot Event-Driven Advisors, LLC, is registered as an investment adviser with the United States Securities and Exchange Commission. Registration as an investment adviser does not imply any certain degree of skill or training. Camelot Event-Driven Advisors, LLC’s disclosure document, ADV Firm Brochure is available at http://adviserinfo.sec.gov/firm/summary/291798

Copyright © 2024 Camelot Event-Driven Advisors, All rights reserved