2024: Year of Transition

by Paul Hoffmeister, Chief Economist

  • We believe the biggest question of 2024 is: what will follow today’s major yield curve inversions?

  • Today, the Fed is signaling a transition from rate hikes to rate cuts.

  • We look at the last three Fed pauses: 2000, 2006 and 2019. The precedents aren’t encouraging. Furthermore, the inverted yield curves of the major Western economies (USA, Canada, UK, France, Germany) are sending an ominous signal.

  • The strong labor market and relatively resilient earnings in the United States are arguably keeping stock prices strong. But economic weakness is emerging.

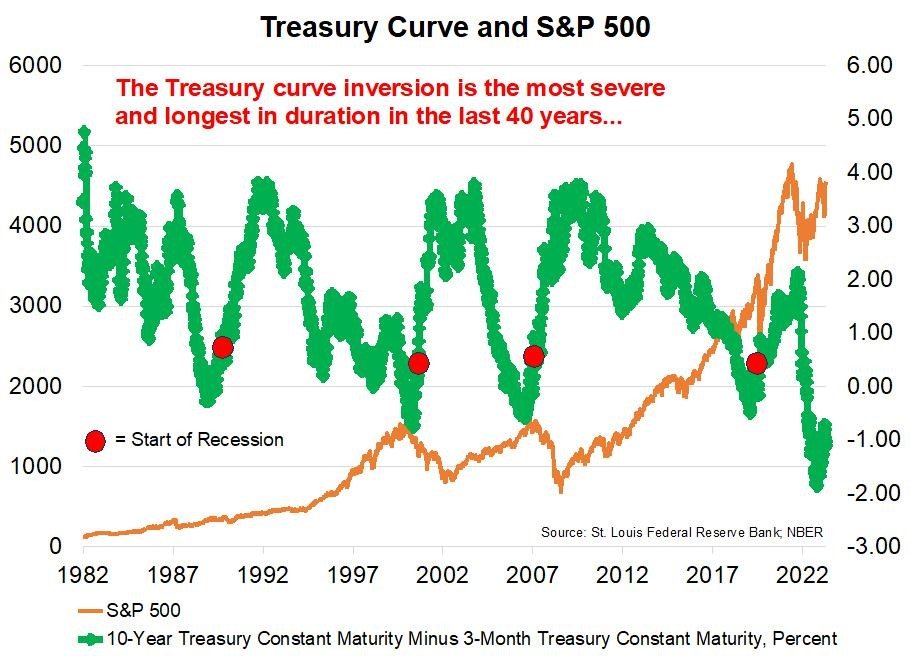
Biggest Question of 2024 & 2025: What Follows This Inversion?

- The previous episodes of Treasury curve inversion led to significant financial and economic harm: the 1989-1990 S&L crisis, bursting of the tech bubble, and the Global Financial Crisis -- as well as recessions on each occasion.
- Today’s yield curve is even more inverted today. We saw major bank failures in Q1 2023, but no recession in the United States. Is that the extent of the financial and economic implications of this interest rate cycle? This is arguably the most important financial question today.

Fed Transitioning From Rate-Hiking to Rate-Cutting

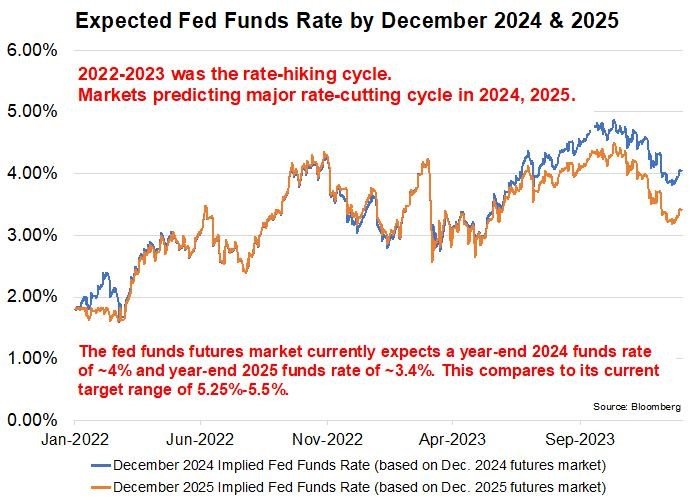
- The dovish shift in the interest rate outlook highlights that this will be a transition year, as we go from the interest-rate hiking cycle of 2022-2023 to the interest rate-cutting cycle of 2024.
- Market expectations for where funds rate will be at end of 2024 and 2025 have declined by 75 to 100 basis points since October.
- Currently, the FOMC is targeting a funds rate range of 5.25%-5.50%. The market expects the fed funds rate to be ~4% by year-end 2024, and ~3.4% by year-end 2025.
- According to the Chicago Mercantile Exchange, fed funds futures suggest that the rate-cutting cycle will begin at the FOMC’s March 20 meeting.

Inflation Falling

- What’s behind the dovish expectations that have emerged in recent months?
- Data are indeed showing a decline in inflation.
- Absent an escalation of geopolitical instability, inflation could continue to behave and give the Fed room to cut interest rates in 2024.

Dovish Outlook Fueled Late 2023 Relief Rally

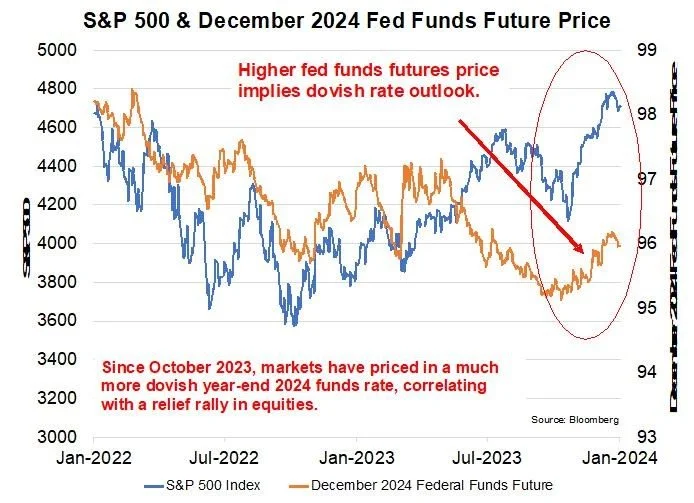
- The S&P jumped more than 15% from its October lows to recent levels.
- Worsening Fed expectations (higher rate expectations) throughout 2022 and early 2023 correlated with weaker stock prices. But that correlation broke down for a few months starting in March 2023, most likely underscoring the importance of the Fed’s “BTFP” program intervention in response to the bank failures at the time.

Bank Stocks Outperform in Late 2023

- Bank stocks jumped more than 30% from their October lows to recent levels.
- In terms of sectors, financials arguably took the interest rate-hiking cycle the most on the chin. KRE fell more than 50% from its 2021 high to its May 2023 low.
- This is understandable. Some banks were blindsided by the Fed changing its telegraph of low rates for a long time to aggressive interest rate increases. Silicon Valley Bank, First Republic, and Credit Suisse were the notable casualties.

Dovish Re-Pricing Tightened Credit Spreads

- Another economically positive byproduct of the dovish shift in late 2023 has been the subsequent tightening in credit spreads, indicating an improvement in financing conditions and risk-taking. This should help economic growth at the margin.

Rate Cycle Transition 2000-2001

- How have equity markets previously behaved in response to a Fed pause after a prolonged rate-hiking cycle? 2000, 2006 and 2019 are the most recent precedents.
- The precedents aren’t too encouraging.
- The 2000 Fed pause was followed by equity market weakness (and coincident economic weakness due to the tech wreck) and ultimately an aggressive rate cut response by the Greenspan Fed.

Rate Cycle Transition 2006-2007

- The 2006 Fed pause was initially followed by a stock market rally. But economic weakness and aggressive Fed policy easing ultimately emerged.

Rate Cycle Transition 2019-2020

- The early 2019 Fed pause was initially followed by a stock market rally. But stock market and economic weakness eventually emerged, causing the Fed to start cutting rates in August 2019.
- Of course, in Q1 2020, the Covid pandemic catalyzed aggressive rate cuts and other monetary measures.

Stocks Holding Up So Far. Why?

- Bears were arguably wrong in 2023. Why? Today’s high government spending (that supported spending and employment) is one possible factor. As we see it, the labor market and earnings were two shoes that didn’t drop last year. Indeed, the labor market and S&P 500 earnings were seemingly irrepressible last year. But will that condition continue in 2024?
- So far, the US unemployment rate is strong at 3.7%. In the past, increases in the unemployment rate corresponded with weak stock indices.
- If the unemployment rate jumps in 2024, that will likely be a headwind for equity returns.

Stocks Holding Up So Far. Why?

- S&P 500 earnings have held up relatively well during the last year.
- However, previous inverted yield curve episodes preceded significant declines in earnings.
- History suggests that both labor markets and earnings are likely to weaken in 2024. Such a combination doesn’t bode well for equities.

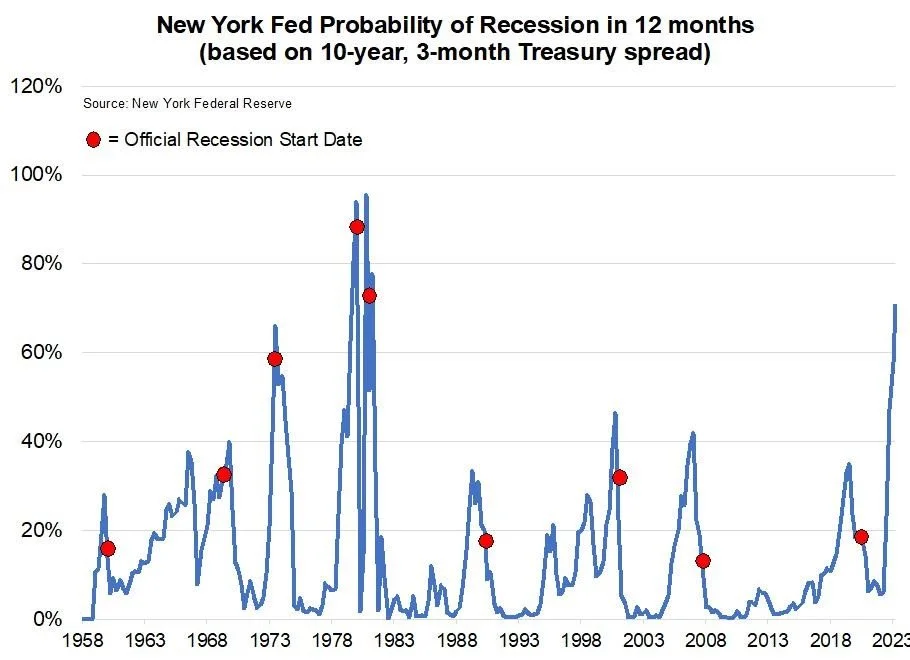
Bond Markets: Ominous Signal?

- Today, many analysts are predicting that the economy will achieve a soft landing after the interest rate shock of 2022-2023.
- But the bond market might be predicting something different. Or is it?
- The government bond curves for the major Western economies (US, Canada, UK, France and Germany) are each inverted and collectively inverted to a degree we’ve never seen in recent decades.
- A pessimistic interpretation of this is that most of the global economy is headed toward a hard landing and severe recession.
- An optimistic interpretation is that the inflation outlook is rapidly improving and Fed policymakers are going to cut rates in 2024-2025, thereby engineering a soft landing.

Unemployment Turning Higher?

- Unemployment in the major Western economies are, for the most part, starting to turn for the worse. Italy is an exception.
- Previous turns in unemployment in Western economies correlated with recession, particularly in the United States.

US Employment Picture

- In the United States, we are seeing a meaningful deterioration in unemployment conditions.
- These permanent job losses are reminiscent of the early stages of the 2001-2002 and 2007-2009 recessions.

Global Manufacturing Picture

- Global manufacturing has been contracting since September 2022 – that’s 15 straight months.

US Services Sector

- US services sector is dangerously close to contraction.
- Typically, contractions in the US service sector coincide with recession.
- In 2021, the US service sector comprised ~78% of the US economy, according to Statista.

US Banking Conditions

- In his November 29, 2023 statement, FDIC Chairman Martin Gruenberg stated: “…the banking industry again proved to be resilient in the third quarter. After excluding non–recurring accounting gains in the first half of 2023, net income would have been roughly flat for the past four quarters at a level considered high by historical measures. In addition, overall asset quality metrics remained favorable and the industry remains well capitalized. However, the banking industry still faces significant challenges from the effects of inflation, rising market interest rates, and geopolitical uncertainty. These risks, combined with concerns about commercial real estate fundamentals, especially in office markets, as well as continued pressure on funding levels and earnings, will be matters of continued supervisory attention by the FDIC.” (source: FDIC: Speeches, Statements & Testimonies - 11/29/2023 - Remarks by FDIC Chairman Martin Gruenberg on the Third Quarter 2023 Quarterly Banking Profile)

In Conclusion ...

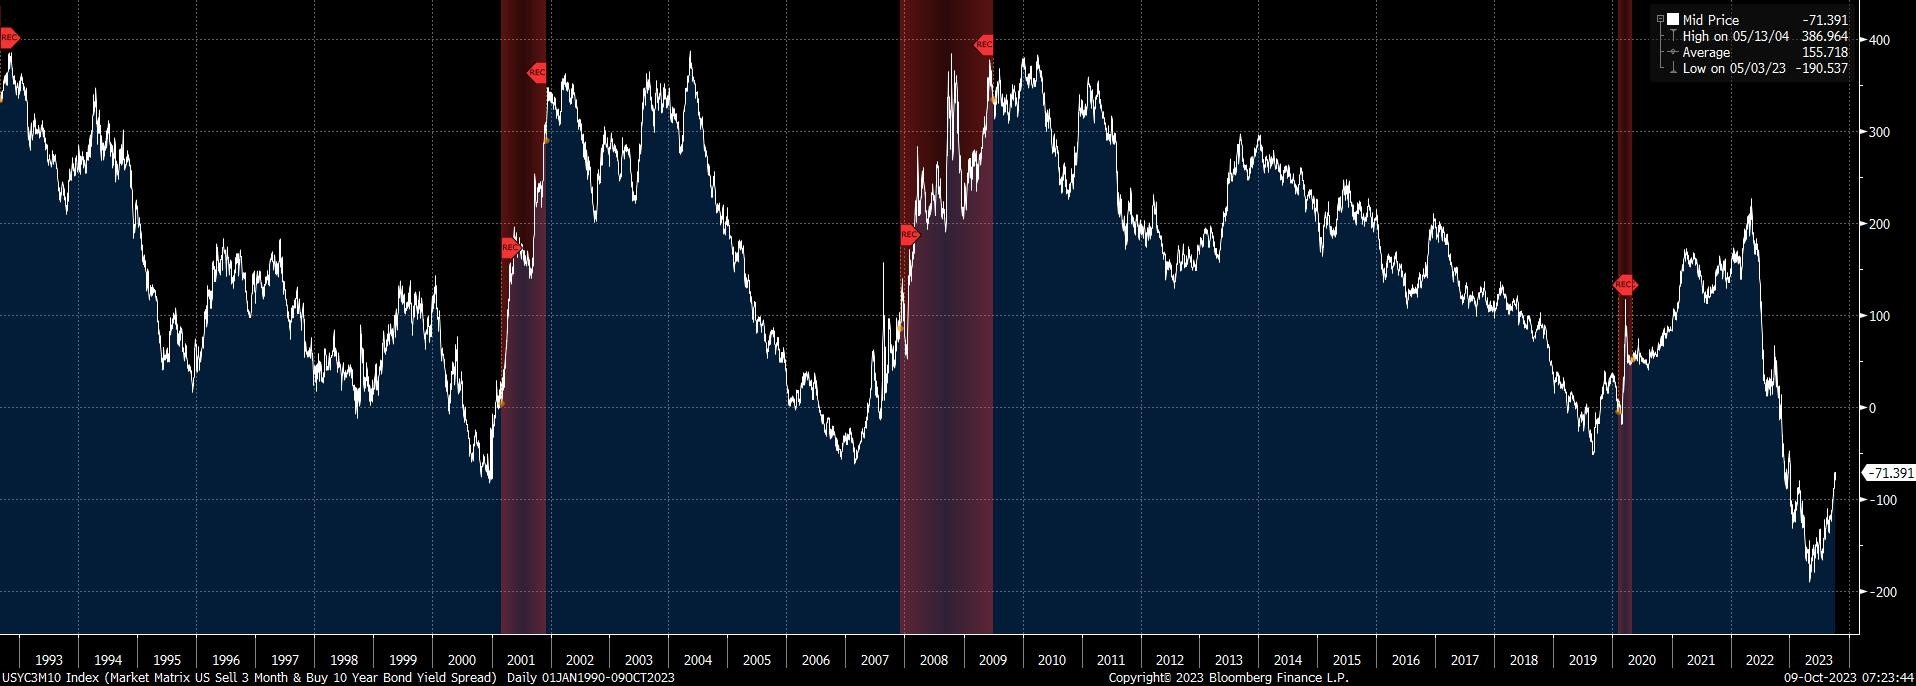
  • Today, the 10-year/3-month Treasury spread is the most inverted it has been since the early 1980s. Furthermore, the sovereign curves of the major Western economies are simultaneously inverted, to significant degrees, casting a worrisome signal of economic prospects.

  • Global manufacturing is weak, US manufacturing is contracting, and the US service sector appears to be on the verge of contraction. At the same time, unemployment rates for many of the major Western economies appear to be turning higher. The confluence of these variables suggest that many countries are entering recession.

  • The Fed is signaling an end to its recent interest-rate hiking cycle and the likelihood of rate cuts in 2024. The Fed rate pauses of 2000, 2006, and 2019 didn’t preclude subsequent economic and equity market weakness.

DIAL IN FOR OUR QUARTERLY
EVENT-DRIVEN CALL
3rd Wednesday of every quarter at 2:00pm EST

REGISTER FOR CALL

Paul Hoffmeister is chief economist and portfolio manager at Camelot Portfolios, managing partner of Camelot Event-Driven Advisors, and co-portfolio manager of the Camelot Event-Driven Fund  (tickers: EVDIX, EVDAX).

Camelot Event-Driven Advisors LLC | 1700 Woodlands Drive | Maumee, OH 43537 // B529
 
Disclosures:
•       Past performance may not be indicative of future results. Therefore, no current or prospective client should assume that the future performance of any specific investment, investment strategy (including the investments and/or investment strategies recommended by the adviser), will be profitable or equal to past performance levels.
•       This material is intended to be educational in nature, and not as a recommendation of any particular strategy, approach, product or concept for any particular advisor or client.  These materials are not intended as any form of substitute for individualized investment advice.  The discussion is general in nature, and therefore not intended to recommend or endorse any asset class, security, or technical aspect of any security for the purpose of allowing a reader to use the approach on their own.  Before participating in any investment program or making any investment, clients as well as all other readers are encouraged to consult with their own professional advisers, including investment advisers and tax advisors.  Camelot Event Driven Advisors can assist in determining a suitable investment approach for a given individual, which may or may not closely resemble the strategies outlined herein.
•       Any charts, graphs, or visual aids presented herein are intended to demonstrate concepts more fully discussed in the text of this brochure, and which cannot be fully explained without the assistance of a professional from Camelot Portfolios LLC.  Readers should not in any way interpret these visual aids as a device with which to ascertain investment decisions or an investment approach.  Only your professional adviser should interpret this information.
•       Some information in this presentation is gleaned from third party sources, and while believed to be reliable, is not independently verified.
•       Camelot Event-Driven Advisors, LLC, is registered as an investment adviser with the United States Securities and Exchange Commission. Registration as an investment adviser does not imply any certain degree of skill or training. Camelot Event-Driven Advisors, LLC’s disclosure document, ADV Firm Brochure is available at http://adviserinfo.sec.gov/firm/summary/291798

Copyright © 2024 Camelot Event-Driven Advisors, All rights reserved.

Labor Market Threatens Equities

by Paul Hoffmeister, Chief Economist

  • Treasury curve most inverted since 1980’s.

  • Longest period of inversion since 1980’s.

  • Russell 2000 has significantly underperformed the S&P 500 and Nasdaq QQQ since banking problems last March; arguably a sign of flight to safety and weakening economic fundamentals.

  • Cooling labor market tends to correlate with weak equity performance.

Two big financial stories of 2023 are the inverted yield curve and the strong returns in large cap stocks. The first is an ominous signal, and the second doesn’t seem too encouraging for the economic outlook.
First, the yield curve. We’re currently witnessing the most inverted Treasury curve since the early 1980’s; not to mention, since then, the yield curve has never been inverted for this length of time.

When looking at the economic history, the inversions that have occurred during the last 4 decades have preceded recessions every time. Specifically, there have been four episodes of inversion, and after each, a recession occurred (with start dates in 1990, 2001, 2007, and 2020). When we assess today’s yield curve alongside other economic indicators, as we’ve laid out in previous client letters, we believe that history will repeat itself and recession will begin in 2024.

Notwithstanding the worrisome outlook that Treasury bonds are suggesting, there is a lot of talk that there will be “no landing” or a “soft landing”; i.e. a recession will be avoided or it’ll be shallow. One of the most popular arguments is the strength of the stock market this year. The S&P 500 is up nearly 19%, and the Nasdaq QQQ’s more than 35%. Indeed, these year-to-date gains in the major indices are impressive. But if we “zoom out”, we get a little better context of what might be happening.

The strong equity returns are not broad-based. Instead, the strength tends to be weighted in large caps and technology. The small cap Russell 2000 Index is up just 7% this year.

As we see it, the outperformance of large cap tech stocks may be a flight to safety in an increasingly precarious economic environment. Furthermore, the stark underperformance by small and more economically sensitive companies isn’t the sign of a vibrant, healthy economy, but rather the sign of weakening economic underpinnings that, in its early stages, is most noticeably impacting the more vulnerable. In terms of vulnerability, Apollo currently estimates that nearly 40% of Russell 2000 companies have negative earnings.  

What’s most noteworthy about the stark difference in stock market performance between large and small caps is the timeline of the divergence in their performance. When the prospects of Fed rate increases began to emerge in early 2022, both tended to perform somewhat “in sync”. But this behavior appears to have broken down since March 2023 when banking problems emerged in the United States and Europe (with the failures of Silicon Valley Bank on March 10 and Signature Bank on March 12, and the takeover of Credit Suisse on March 19). Since the collapse of Silicon Valley Bank on March 10, the S&P 500 has soared nearly 18% and Nasdaq QQQ 33%, while the Russell 2000 has returned almost 6%.

These market internals are more worrisome than heartening, and suggests to us that deeper risks are brewing, and perhaps the banking problems last spring were the early casualties of the current downturn in the business cycle.

As we’ve outlined in recent months, we believe some of the major macro risks today are the real estate crisis and financial risks in China, economic slowdown in Europe (Germany is already in recession), the consumer squeeze, tighter lending conditions, geopolitical risks (Ukraine, Middle East, and Taiwan), and the implications of the weakening commercial real estate sector on banks.

Indeed, weeks ago, FDIC Chairman Martin Gruenberg neatly summarized the risks posed by commercial real estate:

…deterioration in the [banking] industry’s commercial real estate portfolio is beginning to materialize in office properties, in which weak demand for space, softening property values, and higher interest rates are affecting the credit quality of underlying loans. Total noncurrent non–owner–occupied commercial real estate loans increased 36.4 percent from last quarter, and the noncurrent rate for these loans is the highest since third quarter 2014. Higher interest rates pose risks for other commercial real estate properties as well, as maturing fixed–rate loans will need to be renewed at what are now much higher market interest rates.

In other words, noncurrent non-owner-occupied commercial real estate today is the highest in nine years, and the high interest rates today will be especially negative for these fixed-rate loans that are maturing because they’ll need to be refinanced at much higher interest rates. As a result, the risk to banks with large exposures to commercial real estate is likely to be a major story in 2024.  

Based on the economic data in recent months, it appears the slowdown is underway. This was recently acknowledged by Federal Reserve Governor Christopher Waller, who cited October data indicating that consumer spending, manufacturing and non-manufacturing activity are each slowing; meanwhile the labor market is “cooling off”. Indeed, the US unemployment rate has risen from 3.4% in April to 3.9% in October.

DIAL IN FOR OUR QUARTERLY
EVENT-DRIVEN CALL
3rd Wednesday of every quarter at 2:00pm EST

REGISTER FOR CALL

Paul Hoffmeister is chief economist and portfolio manager at Camelot Portfolios, managing partner of Camelot Event-Driven Advisors, and co-portfolio manager of the Camelot Event-Driven Fund  (tickers: EVDIX, EVDAX).

Camelot Event-Driven Advisors LLC | 1700 Woodlands Drive | Maumee, OH 43537 // B525

 
Disclosures:
•       Past performance may not be indicative of future results. Therefore, no current or prospective client should assume that the future performance of any specific investment, investment strategy (including the investments and/or investment strategies recommended by the adviser), will be profitable or equal to past performance levels.
•       This material is intended to be educational in nature, and not as a recommendation of any particular strategy, approach, product or concept for any particular advisor or client.  These materials are not intended as any form of substitute for individualized investment advice.  The discussion is general in nature, and therefore not intended to recommend or endorse any asset class, security, or technical aspect of any security for the purpose of allowing a reader to use the approach on their own.  Before participating in any investment program or making any investment, clients as well as all other readers are encouraged to consult with their own professional advisers, including investment advisers and tax advisors.  Camelot Event Driven Advisors can assist in determining a suitable investment approach for a given individual, which may or may not closely resemble the strategies outlined herein.
•       Any charts, graphs, or visual aids presented herein are intended to demonstrate concepts more fully discussed in the text of this brochure, and which cannot be fully explained without the assistance of a professional from Camelot Portfolios LLC.  Readers should not in any way interpret these visual aids as a device with which to ascertain investment decisions or an investment approach.  Only your professional adviser should interpret this information.
•       Some information in this presentation is gleaned from third party sources, and while believed to be reliable, is not independently verified.
•       Camelot Event-Driven Advisors, LLC, is registered as an investment adviser with the United States Securities and Exchange Commission. Registration as an investment adviser does not imply any certain degree of skill or training. Camelot Event-Driven Advisors, LLC’s disclosure document, ADV Firm Brochure is available at http://adviserinfo.sec.gov/firm/summary/291798

Copyright © 2023 Camelot Event-Driven Advisors, All rights reserved.

Yield Curve Steepening!

by Paul Hoffmeister, Chief Economist

  • Recent yield curve steepening suggests the US economy is slowing down and could enter recession by mid-2024.

  • S&P 500 performance is likely to be limited during the next year given the post-2000 history of yield curve steepening out of deep inversions and with the Fed pursuing a “higher for longer” policy approach.

  • The recent 3.7% unemployment reading doesn’t necessarily prevent a recession from happening soon.

Since July 31st, the S&P 500 has declined more than 6%. But seemingly missed in most market commentary is the fact that the yield curve is experiencing the most aggressive steepening since 2000. During the last 5 months, the spread between the 10-year Treasury yield and 3-month T-Bill has steepened from negative 190 basis points to negative 71 basis points (as of last Friday).

As the chart below shows, the last three recessions began after a steepening from deep inversions occurred. In December 2000, the yield curve reached maximum inversion, and the recession began in March 2001 (3 months later). In February 2007, the yield curve reached maximum inversion, and the recession began in December 2007 (10 months later). In August 2019, the curve reached maximum inversion, and recession began in February 2020 (6 months later).

If the post-2000 relationship between the yield curve and onset of recession is any guide, it’s likely that the next recession in the United States will begin soon; perhaps before year-end or during the first half of 2024. This makes sense considering that interest rate futures are currently pricing in the probability of interest rate cuts in Q3 2024.

Spread between 10-year Treasury/3-month Treasury bill; recession periods highlighted in red. (Source: Bloomberg)

What does this mean for equities? The 2000-2001 and the 2007-2008 steepenings into recession correlated with a weak and declining S&P 500. The 2019-2020 steepening experienced a rising S&P 500 until the Covid pandemic and global shutdown commenced in February 2020, which then triggered both a major equity market selloff and recession. It’s worth noting that by the late summer of 2019, the Federal Reserve had already started cutting rates, which arguably supported equity prices during the second half of that year.    

Spread between 10-year Treasury/3-month Treasury bill AND the S&P 500; recession periods highlighted in red. (Source: Bloomberg)

Bottomline: We believe the recent yield curve steepening is further evidence that we are in the early stages of an economic slowdown and contraction. Furthermore, if contraction does occur, history suggests a strong likelihood of weak equity markets during the next year.

Unfortunately, this year’s strong labor market data -- such as September’s 3.7% unemployment reading from the Bureau of Labor Statistics -- seem to be compelling Federal Reserve policymakers to maintain high interest rates for a longer period of time. In our view, these backward-looking indicators are misleading, and the “higher for longer” policy approach is putting a stranglehold on the economy. After all, the recessions of 2001, 2008-2009, and 2020 began when quarterly unemployment rates had just bottomed at 3.9%, 4.7% and 3.6% respectively. A low unemployment rate today doesn’t necessarily preclude a looming recession.

DIAL IN FOR OUR QUARTERLY
EVENT-DRIVEN CALL
3rd Wednesday of every quarter at 2:00pm EST

REGISTER FOR CALL

Paul Hoffmeister is chief economist and portfolio manager at Camelot Portfolios, managing partner of Camelot Event-Driven Advisors, and co-portfolio manager of the Camelot Event-Driven Fund  (tickers: EVDIX, EVDAX).

Disclosures:
•       Past performance may not be indicative of future results. Therefore, no current or prospective client should assume that the future performance of any specific investment, investment strategy (including the investments and/or investment strategies recommended by the adviser), will be profitable or equal to past performance levels.
•       This material is intended to be educational in nature, and not as a recommendation of any particular strategy, approach, product or concept for any particular advisor or client.  These materials are not intended as any form of substitute for individualized investment advice.  The discussion is general in nature, and therefore not intended to recommend or endorse any asset class, security, or technical aspect of any security for the purpose of allowing a reader to use the approach on their own.  Before participating in any investment program or making any investment, clients as well as all other readers are encouraged to consult with their own professional advisers, including investment advisers and tax advisors.  Camelot Event Driven Advisors can assist in determining a suitable investment approach for a given individual, which may or may not closely resemble the strategies outlined herein.
•       Any charts, graphs, or visual aids presented herein are intended to demonstrate concepts more fully discussed in the text of this brochure, and which cannot be fully explained without the assistance of a professional from Camelot Portfolios LLC.  Readers should not in any way interpret these visual aids as a device with which to ascertain investment decisions or an investment approach.  Only your professional adviser should interpret this information.
•       Some information in this presentation is gleaned from third party sources, and while believed to be reliable, is not independently verified.
•       Camelot Event-Driven Advisors, LLC, is registered as an investment adviser with the United States Securities and Exchange Commission. Registration as an investment adviser does not imply any certain degree of skill or training. Camelot Event-Driven Advisors, LLC’s disclosure document, ADV Firm Brochure is available at http://adviserinfo.sec.gov/firm/summary/291798

Copyright © 2023 Camelot Event-Driven Advisors, All rights reserved.

Economy in a Stranglehold

by Paul Hoffmeister, Chief Economist

Monetary Policy Concerns: The aggressive interest rate hiking cycles by the Federal Reserve and the European Central Bank to combat inflation are negatively impacting their economies and will likely have unintended consequences.

Bullish Sentiment: Many bulls believe that the labor market and GDP remain strong, the 2023 equity rally will expand beyond tech giants, many stocks are attractively priced, and a Fed pause will ignite risk-taking and market indices.

Historical Comparison: Unlike the Fed pause in 1995 by Alan Greenspan, which set the stage for a strong period for financial markets, the current situation differs as the yield curve has meaningfully inverted, indicating significant macroeconomic risks and the likelihood that the Fed has already overdone it.

Economic and Financial Challenges: Several current economic and financial challenges include consumer distress due to rising costs and high debt levels, corporate distress with manufacturing sector contraction and bankruptcies, commercial real estate market issues, tightening lending conditions, China's economic struggles, and Europe's slowdown.

Stranglehold on Growth: We conclude that major Western economies are currently stuck in a "stranglehold" due to central bank policies aimed at controlling inflation. Yield curve inversions and signals of an impending recession should not be ignored, and a shift towards interest rate cuts are likely necessary to address the current economic challenges.

Camelot’s cautious view about the current financial and economic environment is due in part to the brute force use of interest rate policy by the Fed and ECB during the last year to combat inflation. The primary purpose of today’s interest rate shock is to slow economic growth, through something called the ‘monetary policy transmission mechanism’, to reduce general price pressures. It’s a blunt tool that often creates unintended consequences, and we don’t believe this time will be different.

Notwithstanding, the popular mood today is arguably bullish. The predominant case among bulls seems to be that the labor market and GDP remain relatively strong; the financial crisis is behind us (the failures of SVB, Credit Suisse and others occurred in March); the equity rally of 2023 will broaden from a small handful of mega tech companies to the rest of the market; stocks are actually attractively priced (Bank of America recently suggested that excluding the ‘Magnificent 7’ mega-cap tech stocks, the rest of the S&P 500 is trading near 15x earnings); and the Fed pausing its rate hiking campaign, soon if not already, should set stocks free to the upside.

This is seemingly a compelling case. Indeed, Alan Greenspan surprised many by terminating his aggressive rate hikes of 1994 in early 1995, marking the beginning of a historic period for financial markets over the next 5 years. No one knows the future, of course, and perhaps we’re witnessing the beginning of another historic bull run. But what makes today different is that Greenspan stopped raising rates well before the Treasury curve inverted; and the inverted yield curve today strongly suggests to us that serious macro risks exist and the Fed has overdone it. Greenspan’s deft maneuvering in 1995 earned him the title of ‘the Maestro’.

To be specific, when Greenspan signaled an end to his rate hiking cycle in early 1995, the spread between the 10-year Treasury and 3-month T-bill was positive – more than 100 basis points; today it is negative at more than -115 basis points. The difference is equivalent to a major rate cutting cycle of at least eight quarter point reductions.

As we see it, the interest rate shock of 2022-2023 along with high inflation and a general absence of new incentives for risk-taking have created a long list of serious economic and financial problems, such as consumer, corporate and commercial real estate distress, tighter lending conditions, property market distress and a manufacturing recession in China, and general economic malaise in Europe.

In the following, we comment briefly on each, and conclude that the combination of these variables and the current macroeconomic policy trajectory don’t bode well.

Consumer distress: Consumers are ‘stretched’. The San Francisco Federal Reserve has estimated that US households accumulated unprecedented excess savings during the pandemic. By March 2023, households held $500 billion of the $2.1 trillion in total accumulated excess savings. Fed researchers now expect that balance to be drawn down to zero by the end of this month. Making matters worse, consumers are carrying the most credit in history. With both the cost of living and interest rates rising, the consumer situation is increasingly precarious.

Corporate distress growing: Manufacturing appears to be the center of the economic slowdown right now. According to the ISM Purchasing Managers Index (PMI), the U.S. manufacturing sector has been contracting each month since November 2022. According to Bloomberg, last month was the busiest August for corporate bankruptcies on record since 2000. While the ISM Services PMI is indicating growth this year, with the exception of a brief contraction last December, we believe that the persistent contraction in the manufacturing sector will likely lead to a more sustained contraction in the services sector.

Commercial real estate distress and the “doom loop” scenario: As the Wall Street Journal’s Shane Shifflett and Conrad Putzier explained last week, the commercial real estate market is now in “meltdown” due in part to high vacancy rates and falling prices. They report that banks’ total exposure to the market is nearly $3.6 trillion. Shifflet and Putzier make clear: “The banks are in danger of setting off a doom loop scenario where losses on the loans trigger banks to cut lending, which leads to further drops in property prices and yet more losses.”i We expect more banking system stress driven by the deterioration in the quality of their commercial real-estate assets.

Tightening lending conditions: Bank underwriting standards have already been tightening in recent quarters while loan demand is declining; a dynamic similar to the last three recessions. Less credit extended into the economy is less “juice” for risk-taking and economic growth.

China: China’s once- booming property market is in distress; it’s manufacturing sector is contracting; and investment is slowing. According to the United Nations in 2019, China accounted for nearly 30% of global manufacturing output – the leader by a significant margin. Chinese exports declined -14.5% year-over-year in July and -8.8% last month. If China is indeed “The World’s Factory”, then its health is arguably a worrisome barometer of the health of the global economy.

Europe on Brink of Recession: The ECB recently raised its main refinancing rate to 4.25%, from 0% in July 2022. The probability of further rate hikes is unclear given that euro zone growth is expected to slow to 0.8% this year, according to the European Commission. Germany has already entered recession.

As we see it, the macroeconomic summary today is of a vulnerable consumer, contracting manufacturing that will likely beget a slowdown in services, major risks to the banking system from the commercial real estate sector, less credit availability, and a struggling China and Europe. While we’re seeing a marginal policy response by the Bank of China aimed at supporting some sectors in that country, the Fed and ECB are focused on a ‘higher for longer’ policy prescription to keep a chokehold on growth and wring more inflation out of the system. In other words, the major western economies are stuck in a stranglehold for the time being.

The apparent incongruence today between US and European monetary policies and the macroeconomic environment may explain why the yield curves for the major Western economies are each experiencing inversions that are unprecedented for the last few decades. What do these deep and liquid sovereign debt markets know or fear? The yield curve’s prescience during previous interest rate hiking cycles and recessions should be respected rather than ignored. We believe that signals of impending recession are all around us and most probably occurring first in Europe at large; while at the same time serious financial risks are accumulating ever so slowly. The ‘Maestro’ response today would be to surprise with interest rate cuts. Maybe as many as eight quarter-point cuts. If not now, we believe that markets will eventually force it upon the Fed.


i “Real-Estate Doom Loop Threatens America’s Banks,” by Shane Shifflett and Conrad Putzier, September 6, 2023, Wall Street Journal.

DIAL IN FOR OUR QUARTERLY
EVENT-DRIVEN CALL
3rd Wednesday of every quarter at 2:00pm EST

REGISTER FOR CALL

Paul Hoffmeister is chief economist and portfolio manager at Camelot Portfolios, managing partner of Camelot Event-Driven Advisors, and co-portfolio manager of the Camelot Event-Driven Fund  (tickers: EVDIX, EVDAX).

Disclosures:
•       Past performance may not be indicative of future results. Therefore, no current or prospective client should assume that the future performance of any specific investment, investment strategy (including the investments and/or investment strategies recommended by the adviser), will be profitable or equal to past performance levels.
•       This material is intended to be educational in nature, and not as a recommendation of any particular strategy, approach, product or concept for any particular advisor or client.  These materials are not intended as any form of substitute for individualized investment advice.  The discussion is general in nature, and therefore not intended to recommend or endorse any asset class, security, or technical aspect of any security for the purpose of allowing a reader to use the approach on their own.  Before participating in any investment program or making any investment, clients as well as all other readers are encouraged to consult with their own professional advisers, including investment advisers and tax advisors.  Camelot Event Driven Advisors can assist in determining a suitable investment approach for a given individual, which may or may not closely resemble the strategies outlined herein.
•       Any charts, graphs, or visual aids presented herein are intended to demonstrate concepts more fully discussed in the text of this brochure, and which cannot be fully explained without the assistance of a professional from Camelot Portfolios LLC.  Readers should not in any way interpret these visual aids as a device with which to ascertain investment decisions or an investment approach.  Only your professional adviser should interpret this information.
•       Some information in this presentation is gleaned from third party sources, and while believed to be reliable, is not independently verified.
•       Camelot Event-Driven Advisors, LLC, is registered as an investment adviser with the United States Securities and Exchange Commission. Registration as an investment adviser does not imply any certain degree of skill or training. Camelot Event-Driven Advisors, LLC’s disclosure document, ADV Firm Brochure is available at http://adviserinfo.sec.gov/firm/summary/291798

Copyright © 2023 Camelot Event-Driven Advisors, All rights reserved.

Strong Employment Doesn’t Mean All’s Well

by Paul Hoffmeister, Chief Economist

  • The US unemployment rate was 3.7% in May, and other employment data indicate a very high number of job openings and jobs added last month.

  • But the strong labor market does not mean that the US will avoid recession. In fact, history suggests that a recession will begin soon.

  • The unemployment rate tends to reach a cyclical low point right before recession.

  • The Treasury curve and Leading Economic Indicators suggest a recession will begin during the next 12 months. Based on data going back more than 60 years, it will be unprecedented if this didn’t happen.

  • During the second half of 2023, we’re likely to see: unemployment rise, the economy contract, earnings revised lower, and equity markets challenged.

The labor market appears to be so hot that it’s bucking recession concerns. Last week, the Bureau of Labor Statistics released the Job Openings and Labor Turnover Survey (“JOLTS” Survey), showing the US economy had 10.1 million unfilled jobs for the month of April – 750,000 more openings than the 9.35 million that Wall Street expected. For context, the record high for job openings is over 12 million in March 2022; and in February 2020, just prior to the Covid pandemic, openings were just less than 8 million.

Also released last week was the Employment Report, showing the economy added 339,000 jobs in May. Year-to-date, the economy is adding over 300,000 new jobs per month. And even though the unemployment rate rose slightly to 3.7% from 3.4% in April, the low reading two months ago was a 54-year low.

Indeed, employment data like this reflects a strong labor market and resilient economy in the face of the fast and aggressive rate increases by the Federal Reserve, which have raised the federal funds rate from near zero to more than 5% since early 2022.

Is this something to take comfort in? As investors, does the strong labor market allow us to rest easy that the economy will be resilient and avoid recession during the next year? Frankly, we’d say no.

Despite the recent employment data, the economy is vulnerable to falling into a recession, and it could happen surprisingly soon. History has shown that the unemployment rate reaches a cyclical low point right the onset of recession. Moreover, a number of recessions in the past began when the unemployment rate hovered near 4%.

The above chart illustrates how strong labor markets don’t necessarily preclude recession. Furthermore, it shows how the unemployment rate is more of a backward-looking indicator than forward-looking indicator.

And as we’ve expressed many times, forward-looking indicators like leading economic indicators or the yield curve are signaling a high probability of recession soon.

For example, the Index of Leading Economic Indicators for the United States has been consistently weakening since February 2022, and to such a degree that ominously resembles major economic downturns of the last 60 years. According to the Conference Board: “…The LEI continues to warn of an economic contraction this year. [The Board] forecasts a contraction of economic activity starting in Q2 leading to a mild recession by mid-2023.”

At the same time, the New York Federal Reserve estimates a 71% probability that a recession will begin during the next 12 months. This is based on the negative spread between the 10-year and 3-month Treasuries; otherwise known as the “inverted yield curve”.

Although the strong labor market is welcome news these days and it’s arguably helping to support earnings and equity prices, the strong employment data of recent months is a snapshot of the past. In fact, a low unemployment rate during the last six decades hasn’t prevented recessions, and low unemployment rates tend to precede the onset of recession.

Even more, forward-looking indicators are screaming that a recession will begin soon. This means that during the next year, we’re likely to see unemployment rise, the economy contract, earnings revised lower, and equity returns challenged.

DIAL IN FOR OUR QUARTERLY
EVENT-DRIVEN CALL
3rd Wednesday of every quarter at 2:00pm EST

REGISTER FOR CALL

Paul Hoffmeister is chief economist and portfolio manager at Camelot Portfolios, managing partner of Camelot Event-Driven Advisors, and co-portfolio manager of the Camelot Event-Driven Fund  (tickers: EVDIX, EVDAX).

Camelot Event-Driven Advisors LLC | 1700 Woodlands Drive | Maumee, OH 43537 // B481

Disclosures:
•       Past performance may not be indicative of future results. Therefore, no current or prospective client should assume that the future performance of any specific investment, investment strategy (including the investments and/or investment strategies recommended by the adviser), will be profitable or equal to past performance levels.
•       This material is intended to be educational in nature, and not as a recommendation of any particular strategy, approach, product or concept for any particular advisor or client.  These materials are not intended as any form of substitute for individualized investment advice.  The discussion is general in nature, and therefore not intended to recommend or endorse any asset class, security, or technical aspect of any security for the purpose of allowing a reader to use the approach on their own.  Before participating in any investment program or making any investment, clients as well as all other readers are encouraged to consult with their own professional advisers, including investment advisers and tax advisors.  Camelot Event Driven Advisors can assist in determining a suitable investment approach for a given individual, which may or may not closely resemble the strategies outlined herein.
•       Any charts, graphs, or visual aids presented herein are intended to demonstrate concepts more fully discussed in the text of this brochure, and which cannot be fully explained without the assistance of a professional from Camelot Portfolios LLC.  Readers should not in any way interpret these visual aids as a device with which to ascertain investment decisions or an investment approach.  Only your professional adviser should interpret this information.
•       Some information in this presentation is gleaned from third party sources, and while believed to be reliable, is not independently verified.
•       Camelot Event-Driven Advisors, LLC, is registered as an investment adviser with the United States Securities and Exchange Commission. Registration as an investment adviser does not imply any certain degree of skill or training. Camelot Event-Driven Advisors, LLC’s disclosure document, ADV Firm Brochure is available at http://adviserinfo.sec.gov/firm/summary/291798

Copyright © 2023 Camelot Event-Driven Advisors, All rights reserved.