
by Paul Hoffmeister, Chief Economist
Recent yield curve steepening suggests the US economy is slowing down and could enter recession by mid-2024.
S&P 500 performance is likely to be limited during the next year given the post-2000 history of yield curve steepening out of deep inversions and with the Fed pursuing a “higher for longer” policy approach.
The recent 3.7% unemployment reading doesn’t necessarily prevent a recession from happening soon.
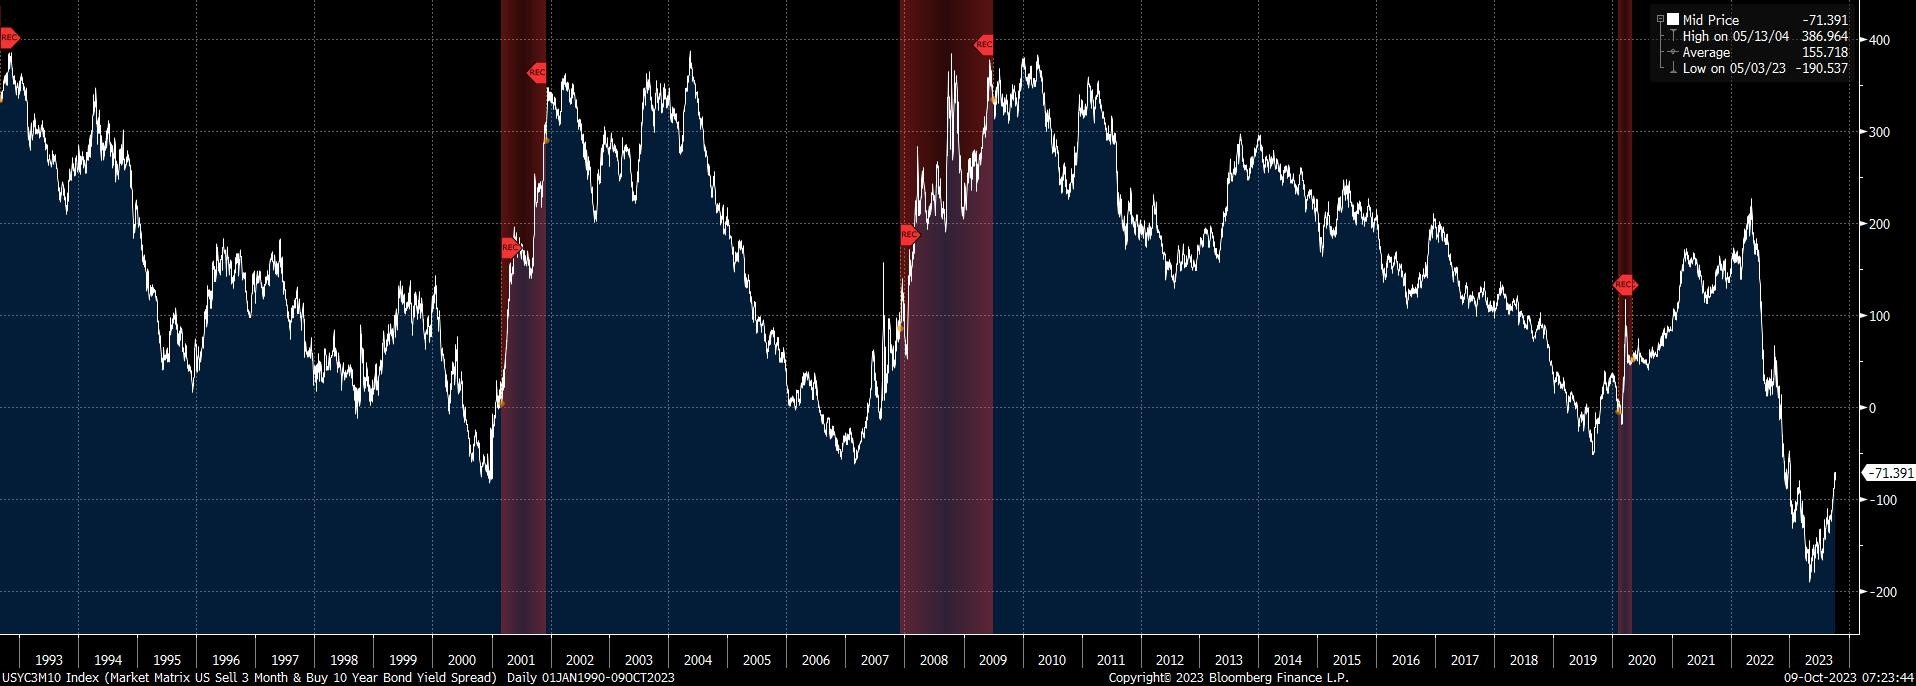
Since July 31st, the S&P 500 has declined more than 6%. But seemingly missed in most market commentary is the fact that the yield curve is experiencing the most aggressive steepening since 2000. During the last 5 months, the spread between the 10-year Treasury yield and 3-month T-Bill has steepened from negative 190 basis points to negative 71 basis points (as of last Friday).
As the chart below shows, the last three recessions began after a steepening from deep inversions occurred. In December 2000, the yield curve reached maximum inversion, and the recession began in March 2001 (3 months later). In February 2007, the yield curve reached maximum inversion, and the recession began in December 2007 (10 months later). In August 2019, the curve reached maximum inversion, and recession began in February 2020 (6 months later).
If the post-2000 relationship between the yield curve and onset of recession is any guide, it’s likely that the next recession in the United States will begin soon; perhaps before year-end or during the first half of 2024. This makes sense considering that interest rate futures are currently pricing in the probability of interest rate cuts in Q3 2024.
Spread between 10-year Treasury/3-month Treasury bill; recession periods highlighted in red. (Source: Bloomberg)
What does this mean for equities? The 2000-2001 and the 2007-2008 steepenings into recession correlated with a weak and declining S&P 500. The 2019-2020 steepening experienced a rising S&P 500 until the Covid pandemic and global shutdown commenced in February 2020, which then triggered both a major equity market selloff and recession. It’s worth noting that by the late summer of 2019, the Federal Reserve had already started cutting rates, which arguably supported equity prices during the second half of that year.
Spread between 10-year Treasury/3-month Treasury bill AND the S&P 500; recession periods highlighted in red. (Source: Bloomberg)

Bottomline: We believe the recent yield curve steepening is further evidence that we are in the early stages of an economic slowdown and contraction. Furthermore, if contraction does occur, history suggests a strong likelihood of weak equity markets during the next year.
Unfortunately, this year’s strong labor market data -- such as September’s 3.7% unemployment reading from the Bureau of Labor Statistics -- seem to be compelling Federal Reserve policymakers to maintain high interest rates for a longer period of time. In our view, these backward-looking indicators are misleading, and the “higher for longer” policy approach is putting a stranglehold on the economy. After all, the recessions of 2001, 2008-2009, and 2020 began when quarterly unemployment rates had just bottomed at 3.9%, 4.7% and 3.6% respectively. A low unemployment rate today doesn’t necessarily preclude a looming recession.
DIAL IN FOR OUR QUARTERLY
EVENT-DRIVEN CALL
3rd Wednesday of every quarter at 2:00pm EST
REGISTER FOR CALL

Paul Hoffmeister is chief economist and portfolio manager at Camelot Portfolios, managing partner of Camelot Event-Driven Advisors, and co-portfolio manager of the Camelot Event-Driven Fund (tickers: EVDIX, EVDAX).
Disclosures:
• Past performance may not be indicative of future results. Therefore, no current or prospective client should assume that the future performance of any specific investment, investment strategy (including the investments and/or investment strategies recommended by the adviser), will be profitable or equal to past performance levels.
• This material is intended to be educational in nature, and not as a recommendation of any particular strategy, approach, product or concept for any particular advisor or client. These materials are not intended as any form of substitute for individualized investment advice. The discussion is general in nature, and therefore not intended to recommend or endorse any asset class, security, or technical aspect of any security for the purpose of allowing a reader to use the approach on their own. Before participating in any investment program or making any investment, clients as well as all other readers are encouraged to consult with their own professional advisers, including investment advisers and tax advisors. Camelot Event Driven Advisors can assist in determining a suitable investment approach for a given individual, which may or may not closely resemble the strategies outlined herein.
• Any charts, graphs, or visual aids presented herein are intended to demonstrate concepts more fully discussed in the text of this brochure, and which cannot be fully explained without the assistance of a professional from Camelot Portfolios LLC. Readers should not in any way interpret these visual aids as a device with which to ascertain investment decisions or an investment approach. Only your professional adviser should interpret this information.
• Some information in this presentation is gleaned from third party sources, and while believed to be reliable, is not independently verified.
• Camelot Event-Driven Advisors, LLC, is registered as an investment adviser with the United States Securities and Exchange Commission. Registration as an investment adviser does not imply any certain degree of skill or training. Camelot Event-Driven Advisors, LLC’s disclosure document, ADV Firm Brochure is available at http://adviserinfo.sec.gov/firm/summary/291798
Copyright © 2023 Camelot Event-Driven Advisors, All rights reserved.